 |
Melton Hockey Club |
|
Last updated : 11:46 am - 2 November 2023
Club Cap : 425
(Games : 158, Goals : 41 )
First XI Men's Cap : 113
(Games : 24, Goals : 4)
Milestones
| 1999-Apr-17 : | First Junior game (Melton 9 def. Hawthorn 0. R-01: 1999 U13 North) |
| 1999-Apr-17 : | First game (Melton 9 def. Hawthorn 0. R-01: 1999 U13 North) |
| 1999-May-28 : | First goal scored (Melton 6 def. Yarra Valley 0. R-07: 1999 U13 North) |
| 2004-Apr-17 : | First Senior game (Melton 11 def. Werribee 0. R-01: 2004 Metro 3 West Men) |
| 2004-Apr-17 : | First Senior goal (Melton 11 def. Werribee 0. R-01: 2004 Metro 3 West Men) |
| 2004-May-21 : | 50 Junior games (Melton 10 def. Waverley 0. R-06: 2004 U17) |
| 2004-Aug-21 : | First First XI Mens game (Sth. Knights 4 def. Melton 1. R-17: 2004 State League 4 Men) |
| 2005-Aug-26 : | Last Junior game (Melton 6 def. Yarra Valley 0. R-18: 2005 U17 Pennant North) |
| 2006-Sep-02 : | Last First XI Mens game played (Melton 3 def. Casey 2. R-18: 2006 State League 4 Men) |
| 2007-Feb-13 : | Last Senior game (Melton 8 def. Footscray (A) 0. R-10: 2006/07 Footscray Tues. Men) |
| 2007-Feb-13 : | Last game played (Melton 8 def. Footscray (A) 0. R-10: 2006/07 Footscray Tues. Men) |
| Playing career : 2859 days. (7 years and 304 days.) |
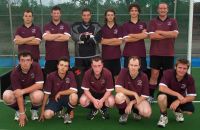
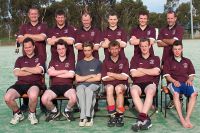
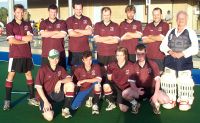
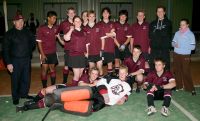
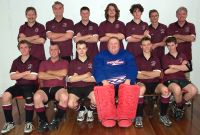
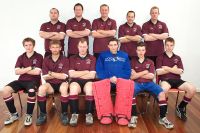
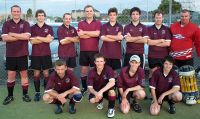
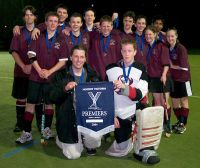
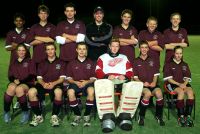
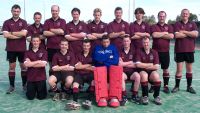
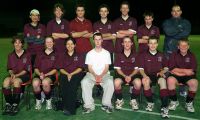
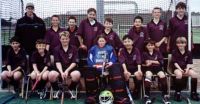
Team Photographs
Complete Playing History
Teams played with : 15
Premierships won : 1
Wooden Spoons : 2
| Games as Player |
Games Won | Games Drawn | Games Lost | Total | Goals | Goalscoring Average |
|---|---|---|---|---|---|---|
| Junior Winter | 38 | 4 | 23 | 65 | 18 | 0.277 |
| Junior Summer | 4 | 0 | 6 | 10 | 0 | 0.000 |
| Junior Total | 42 | 4 | 29 | 75 | 18 | 0.273 |
| Senior Winter | 27 | 9 | 17 | 53 | 14 | 0.264 |
| Senior Summer | 13 | 7 | 10 | 30 | 9 | 0.300 |
| Senior Total | 40 | 16 | 27 | 83 | 23 | 0.277 |
| Total | 82 | 20 | 56 | 158 | 41 | 0.275 |
| Pos. | PR/WS | Div. | Competition | Games | Goals | Avge. | Won | Drawn | Lost | Avge.For | Avge.Aga | Avge.Diff | G.For | G.Aga | GoalDiff |
|---|---|---|---|---|---|---|---|---|---|---|---|---|---|---|---|
| 6 | WS | 2006/07 Footscray Tues. Men* | 7 | 5 | 0.714 | 1 | 2 | 4 | 1.857 | 2.143 | -0.286 | 13 | 15 | -002 | |
| 9 | 2006 State League 4 Men* | 16 | 3 | 0.188 | 4 | 3 | 9 | 2.063 | 2.813 | -0.750 | 33 | 45 | -012 | ||
| 1 | 2006 Metro 4 West Men* | 1 | 1 | 4.000 | 1.000 | +3.000 | 4 | 1 | +003 | ||||||
| 4 | 2005/06 Footscray Tues. A Men* | 12 | 4 | 0.333 | 5 | 4 | 3 | 2.833 | 2.000 | +0.833 | 34 | 24 | +010 | ||
| 2 | 2005 State League 5 Men* | 6 | 1 | 0.167 | 4 | 1 | 1 | 4.167 | 2.000 | +2.167 | 25 | 12 | +013 | ||
| 4 | 2005 Metro 3 West Men* | 14 | 8 | 0.571 | 9 | 2 | 3 | 3.214 | 1.571 | +1.643 | 45 | 22 | +023 | ||
| 8 | 2005 U17 Pennant North* | 12 | 3 | 0.250 | 6 | 6 | 2.083 | 2.167 | -0.083 | 25 | 26 | -001 | |||
| 2 | 2004/05 Footscray Tues. Men* | 11 | 7 | 1 | 3 | 1.727 | 1.364 | +0.364 | 19 | 15 | +004 | ||||
| 9 | 2004 State League 4 Men* | 2 | 2 | 1.000 | 3.000 | -2.000 | 2 | 6 | -004 | ||||||
| 2 | 2004 Metro 3 West Men* | 14 | 2 | 0.143 | 9 | 3 | 2 | 5.143 | 2.214 | +2.929 | 72 | 31 | +041 | ||
| 1 | PR | 2004 U17* | 18 | 8 | 0.444 | 16 | 2 | 4.667 | 0.833 | +3.833 | 84 | 15 | +069 | ||
| 6 | 2003 U17 Pennant North* | 14 | 4 | 0.286 | 3 | 2 | 9 | 2.071 | 3.071 | -1.000 | 29 | 43 | -014 | ||
| 5 | 1999/00 U15 Altona Indoor | 10 | 4 | 6 | 5.200 | 5.500 | -0.300 | 52 | 55 | -003 | |||||
| 2 | 1999 U13 North* | 19 | 3 | 0.158 | 13 | 1 | 5 | 5.684 | 0.947 | +4.737 | 108 | 18 | +090 | ||
| 11 | WS | 1999 U11 North* | 2 | 1 | 1 | 0.000 | 0.500 | -0.500 | 0 | 1 | -001 | ||||
| 158 | 41 | 0.259 | 82 | 20 | 56 | 3.609 | 2.082 | +1.367 | 545 | 329 | +216 |
Junior Winter Playing History
| Games as Player |
Games Won | Games Drawn | Games Lost | Total | Goals | Goalscoring Average |
|---|---|---|---|---|---|---|
| Junior Winter | 38 | 4 | 23 | 65 | 18 | 0.277 |
| First Game : | Melton 9 def. Hawthorn 0. R-01: 1999 U13 North |
| Last Game : | Melton 6 def. Yarra Valley 0. R-18: 2005 U17 Pennant North |
| Best Win : | Melton 17 def. MHSOB 0. R-14: 1999 U13 North |
| Worst Loss : | Greensborough 6 def. Melton 0. R-11: 2003 U17 Pennant North |
| 1 goal games : | 12 times. Last : Melton 6 def. Yarra Valley 0. R-18: 2005 U17 Pennant North |
| 2 goal games : | 3 times. Last : Melton 7 def. Waverley 1. R-15: 2004 U17 |
| Finals : | Essendon (1) 3 def. Melton 2. GF: 1999 U13 North Melton 1 def. Essendon (2) 0. SF: 1999 U13 North Melton 3 def. Yarra Valley 2. GF: 2004 U17 Melton 1 def. Camberwell 1. SF: 2004 U17 |
| Premierships : | Melton 3 def. Yarra Valley 2. GF: 2004 U17 |
Junior Summer Playing History
| Games as Player |
Games Won | Games Drawn | Games Lost | Total | Goals | Goalscoring Average |
|---|---|---|---|---|---|---|
| Junior Summer | 4 | 0 | 6 | 10 | 0 | 0.000 |
| First Game : | Essendon 8 def. Melton 1. R-01: 1999/00 U15 Altona Indoor |
| Last Game : | Melton 4 def. Brunswick 0. CF: 1999/00 U15 Altona Indoor |
| Best Win : | Melton 12 def. Altona (H) 2. R-05: 1999/00 U15 Altona Indoor |
| Worst Loss : | Footscray 15 def. Melton 0. R-02: 1999/00 U15 Altona Indoor |
| Finals : | Melton 4 def. Brunswick 0. CF: 1999/00 U15 Altona Indoor |
| Premierships : | None. |
Senior Winter Playing History
| Games as Player |
Games Won | Games Drawn | Games Lost | Total | Goals | Goalscoring Average |
|---|---|---|---|---|---|---|
| Senior Winter | 27 | 9 | 17 | 53 | 14 | 0.264 |
| First Game : | Melton 11 def. Werribee 0. R-01: 2004 Metro 3 West Men |
| Last Game : | Melton 3 def. Casey 2. R-18: 2006 State League 4 Men |
| Best Win : | Melton 11 def. Werribee 0. R-01: 2004 Metro 3 West Men |
| Worst Loss : | Baw-Baw 7 def. Melton 1. R-02: 2006 State League 4 Men |
| 1 goal games : | 10 times. Last : Trinity 3 def. Melton 2. R-17: 2006 State League 4 Men |
| 2 goal games : | 2 times. Last : Melton 5 def. Trinity 0. R-08: 2006 State League 4 Men |
| Finals : | Brunswick 2 def. Melton 1. GF: 2004 Metro 3 West Men Melton 6 def. Essendon 4. SF: 2004 Metro 3 West Men St.Bedes 4 def. Melton 2. GF: 2005 State League 5 Men Melton 3 def. Collegians-X 2. PF: 2005 State League 5 Men Old Melburnians 1 def. Melton 0. SF: 2005 Metro 3 West Men |
| Premierships : | None. |
Senior Summer Playing History
| Games as Player |
Games Won | Games Drawn | Games Lost | Total | Goals | Goalscoring Average |
|---|---|---|---|---|---|---|
| Senior Summer | 13 | 7 | 10 | 30 | 9 | 0.300 |
| First Game : | Melton 1 def. Ballarat 0. R-01: 2004/05 Footscray Tues. Men |
| Last Game : | Melton 8 def. Footscray (A) 0. R-10: 2006/07 Footscray Tues. Men |
| Best Win : | Melton 8 def. Footscray (A) 0. R-10: 2006/07 Footscray Tues. Men |
| Worst Loss : | Footscray (B) 6 def. Melton 1. R-01: 2006/07 Footscray Tues. Men |
| 1 goal games : | 5 times. Last : PEGS 2 def. Melton 1. R-08: 2006/07 Footscray Tues. Men |
| 2 goal games : | 2 times. Last : Melton 8 def. Footscray (A) 0. R-10: 2006/07 Footscray Tues. Men |
| Finals : | PEGS 2 def. Melton 1. GF: 2004/05 Footscray Tues. Men Melton 2 def. Footscray 2. SF: 2004/05 Footscray Tues. Men PEGS 3 def. Melton 1. CF: 2005/06 Footscray Tues. A Men Essendon 4 def. Melton 3. SF: 2005/06 Footscray Tues. A Men |
| Premierships : | None. |
Teammates
Number of teammates :83
| Player |
Games |
Win % | Draw % | Loss % | Unkn % | Avge. Points |
Avge. For | Avge. Aga | Avge. Diff. |
|---|---|---|---|---|---|---|---|---|---|
| Arnold, Andrew* | 122 | 52% | 13% | 34% | 1.705 | 3.869 | 2.180 | +1.689 | |
| Brazil, Sean* | 85 | 42% | 15% | 42% | 1.424 | 3.459 | 2.447 | +1.012 | |
| MacKinnon, Robert* | 81 | 62% | 10% | 28% | 1.951 | 4.247 | 1.654 | +2.593 | |
| Darcy, Astin* | 80 | 55% | 11% | 34% | 1.763 | 4.025 | 2.250 | +1.775 | |
| May, Adrian* | 58 | 47% | 10% | 43% | 1.500 | 3.776 | 2.500 | +1.276 | |
| Dine, Brenton* | 52 | 69% | 6% | 25% | 2.135 | 3.173 | 1.442 | +1.731 | |
| Sorensen, Steven* | 50 | 36% | 22% | 42% | 1.300 | 2.360 | 2.180 | +0.180 | |
| Slocombe, Morgan* | 49 | 49% | 6% | 45% | 1.531 | 4.286 | 2.592 | +1.694 | |
| McLaren, Scott* | 44 | 45% | 20% | 34% | 1.568 | 2.523 | 2.114 | +0.409 | |
| Strobel, Joshua* | 43 | 47% | 7% | 47% | 1.465 | 4.395 | 2.698 | +1.698 | |
| Arnold, Chris* | 43 | 33% | 23% | 44% | 1.209 | 2.488 | 2.372 | +0.116 | |
| Hanley-Wood, Ben* | 43 | 33% | 26% | 42% | 1.233 | 2.488 | 2.326 | +0.163 | |
| Lawrence, Stephen* | 40 | 43% | 25% | 33% | 1.525 | 3.300 | 2.200 | +1.100 | |
| Noonan, Kristian* | 40 | 58% | 8% | 35% | 1.800 | 2.525 | 1.925 | +0.600 | |
| Edwards, Jeremy* | 39 | 62% | 5% | 33% | 1.897 | 3.410 | 1.667 | +1.744 | |
| Downs, David* | 37 | 41% | 19% | 41% | 1.405 | 2.270 | 2.027 | +0.243 | |
| Rihs, Daniel* | 37 | 38% | 22% | 41% | 1.351 | 2.351 | 2.324 | +0.027 | |
| Kovarik, Hans* | 36 | 61% | 17% | 22% | 2.000 | 3.306 | 1.861 | +1.444 | |
| Self, Ryan* | 33 | 73% | 3% | 24% | 2.212 | 3.818 | 1.333 | +2.485 | |
| Spence, Jessica* | 32 | 69% | 3% | 28% | 2.094 | 3.406 | 1.313 | +2.094 | |
| Stanyer, Adrian* | 32 | 31% | 19% | 50% | 1.125 | 2.344 | 2.469 | -0.125 | |
| Matthews, Ben* | 32 | 66% | 3% | 31% | 2.000 | 3.281 | 1.531 | +1.750 | |
| Goodwin, Leigh* | 30 | 40% | 23% | 37% | 1.433 | 2.533 | 2.133 | +0.400 | |
| Baxter, Adrian* | 29 | 59% | 3% | 38% | 1.793 | 5.517 | 2.517 | +3.000 | |
| York, Mitchell* | 29 | 59% | 3% | 38% | 1.793 | 5.517 | 2.517 | +3.000 | |
| Bonney, Michael* | 29 | 76% | 24% | 2.276 | 3.759 | 1.345 | +2.414 | ||
| Burmistrow, Brendan | 28 | 61% | 4% | 36% | 1.857 | 5.643 | 2.500 | +3.143 | |
| Cross, Tim* | 28 | 61% | 4% | 36% | 1.857 | 5.679 | 2.536 | +3.143 | |
| Powderly, Phillip* | 28 | 29% | 18% | 54% | 1.036 | 2.321 | 2.750 | -0.429 | |
| Lawrence, Tony* | 28 | 64% | 18% | 18% | 2.107 | 4.179 | 1.893 | +2.286 | |
| Shadbolt, Ron* | 28 | 64% | 18% | 18% | 2.107 | 4.179 | 1.893 | +2.286 | |
| Dempsey, Michael* | 27 | 44% | 19% | 37% | 1.519 | 3.704 | 2.556 | +1.148 | |
| Bluschke, Alf* | 26 | 65% | 19% | 15% | 2.154 | 4.385 | 1.846 | +2.538 | |
| Holahan, Zac* | 25 | 84% | 16% | 2.520 | 4.080 | 1.160 | +2.920 | ||
| Cox, Caitlyn* | 23 | 74% | 26% | 2.217 | 3.739 | 1.348 | +2.391 | ||
| Irvine, Andrew* | 22 | 64% | 14% | 23% | 2.045 | 3.409 | 1.864 | +1.545 | |
| Mouanoutoua, Edward* | 19 | 74% | 5% | 21% | 2.263 | 5.684 | 0.842 | +4.842 | |
| MacKinnon, Tim* | 19 | 58% | 21% | 21% | 1.947 | 4.263 | 2.053 | +2.211 | |
| Huntley, Nick* | 17 | 71% | 6% | 24% | 2.176 | 6.176 | 0.882 | +5.294 | |
| Kasprzak, Alex* | 17 | 88% | 12% | 2.647 | 4.706 | 0.882 | +3.824 | ||
| Mumford, Matthew* | 14 | 50% | 50% | 1.500 | 2.071 | 2.000 | +0.071 | ||
| Rewkiewicz, Casey* | 14 | 21% | 14% | 64% | 0.786 | 2.071 | 3.071 | -1.000 | |
| Cook, Stuart* | 14 | 71% | 14% | 14% | 2.286 | 3.857 | 1.357 | +2.500 | |
| Dyke, Leanne* | 13 | 23% | 15% | 62% | 0.846 | 2.154 | 2.846 | -0.692 | |
| Leslie, Darren* | 12 | 17% | 8% | 75% | 0.583 | 1.500 | 3.417 | -1.917 | |
| Cameron, John* | 12 | 67% | 8% | 25% | 2.083 | 3.250 | 1.583 | +1.667 | |
| Lawrence, William* | 12 | 42% | 33% | 25% | 1.583 | 2.833 | 2.000 | +0.833 | |
| Williams, Mark* | 11 | 73% | 9% | 18% | 2.273 | 5.000 | 1.636 | +3.364 | |
| Lawrence, Glenn* | 10 | 60% | 10% | 30% | 1.900 | 3.400 | 2.100 | +1.300 | |
| Gilham, Mark* | 10 | 50% | 30% | 20% | 1.800 | 4.300 | 2.400 | +1.900 | |
| Duffy, Craig* | 10 | 60% | 10% | 30% | 1.900 | 1.700 | 1.500 | +0.200 | |
| Hosking, Michael* | 10 | 60% | 40% | 1.800 | 2.300 | 1.900 | +0.400 | ||
| Spence, Dion* | 9 | 56% | 22% | 22% | 1.889 | 4.111 | 2.333 | +1.778 | |
| Baker, Daniel* | 8 | 25% | 38% | 38% | 1.125 | 2.000 | 1.250 | +0.750 | |
| Downs, Andrew* | 7 | 29% | 14% | 57% | 1.000 | 1.714 | 1.286 | +0.429 | |
| Govan, Jeff* | 7 | 100% | 3.000 | 7.000 | 1.286 | +5.714 | |||
| Buttigieg, William* | 6 | 17% | 33% | 50% | 0.833 | 2.000 | 1.500 | +0.500 | |
| Spence, Adam* | 5 | 20% | 20% | 60% | 0.800 | 1.000 | 1.800 | -0.800 | |
| Hocking, Branton* | 4 | 100% | 3.000 | 4.500 | 0.500 | +4.000 | |||
| Haycock, John* | 4 | 50% | 50% | 1.500 | 3.250 | 1.000 | +2.250 | ||
| Eley, Clive* | 3 | 33% | 33% | 33% | 1.333 | 4.000 | 2.667 | +1.333 | |
| Cautley, Mark* | 3 | 67% | 33% | 2.000 | 3.333 | 2.333 | +1.000 | ||
| Doran, Dale* | 2 | 50% | 50% | 0.500 | 0.000 | 0.500 | -0.500 | ||
| Doran, Kimberly* | 2 | 50% | 50% | 0.500 | 0.000 | 0.500 | -0.500 | ||
| Graetz, Ashley* | 2 | 50% | 50% | 0.500 | 0.000 | 0.500 | -0.500 | ||
| Taylor, Raine* | 2 | 50% | 50% | 0.500 | 0.000 | 0.500 | -0.500 | ||
| Crebbin, Jason* | 2 | 100% | 0.000 | 1.000 | 3.000 | -2.000 | |||
| Granville, Alan* | 2 | 50% | 50% | 1.500 | 1.500 | 1.000 | +0.500 | ||
| Kari, Grant* | 2 | 50% | 50% | 2.000 | 5.000 | 1.500 | +3.500 | ||
| Lawrence, Daryl* | 2 | 50% | 50% | 1.500 | 3.500 | 4.000 | -0.500 | ||
| Adhofoer, Hayley* | 1 | 100% | 0.000 | 0.000 | 1.000 | -1.000 | |||
| Mumford, Nicole* | 1 | 100% | 0.000 | 0.000 | 1.000 | -1.000 | |||
| Graetz, Brian* | 1 | 100% | 1.000 | 0.000 | 0.000 | +0.000 | |||
| Jennings, Ian* | 1 | 100% | 0.000 | 1.000 | 2.000 | -1.000 | |||
| Arnold, David* | 1 | 100% | 0.000 | 0.000 | 3.000 | -3.000 | |||
| Thomas, Joshua* | 1 | 100% | 0.000 | 0.000 | 3.000 | -3.000 | |||
| Clough, Jarryd* | 1 | 100% | 0.000 | 1.000 | 5.000 | -4.000 | |||
| Bosquet, Dane* | 1 | 100% | 3.000 | 6.000 | 0.000 | +6.000 | |||
| Cowland, Dean* | 1 | 100% | 0.000 | 1.000 | 7.000 | -6.000 | |||
| Baker, Gavin* | 1 | 100% | 3.000 | 4.000 | 1.000 | +3.000 | |||
| Brierley, John* | 1 | 100% | 3.000 | 4.000 | 1.000 | +3.000 | |||
| Falcao, Hip* | 1 | 100% | 3.000 | 4.000 | 1.000 | +3.000 | |||
| Hoad, Simon* | 1 | 100% | 3.000 | 4.000 | 1.000 | +3.000 |
Opposition Teams
| Opponent |
Games |
Goals | Avge |
Win % | Draw % | Loss % | Unkn % | Avge. Points |
Avge. For | Avge. Aga | Avge. Diff. |
G.K. Games | Shut- outs | Shut- out % | Goals In | Goals Avge |
|---|---|---|---|---|---|---|---|---|---|---|---|---|---|---|---|---|
| Essendon | 18 | 2 | 0.111 | 44% | 17% | 39% | 1.500 | 2.778 | 2.500 | +0.278 | ||||||
| PEGS | 14 | 3 | 0.214 | 21% | 29% | 50% | 0.929 | 1.714 | 2.429 | -0.714 | ||||||
| Footscray | 13 | 5 | 0.385 | 46% | 23% | 31% | 1.615 | 3.154 | 3.000 | +0.154 | ||||||
| Yarra Valley | 11 | 5 | 0.455 | 73% | 27% | 2.182 | 3.364 | 1.273 | +2.091 | |||||||
| Brunswick | 9 | 44% | 56% | 1.333 | 2.222 | 2.778 | -0.556 | |||||||||
| Greensborough | 8 | 50% | 50% | 1.500 | 2.000 | 2.125 | -0.125 | |||||||||
| RMIT | 8 | 5 | 0.625 | 63% | 13% | 25% | 2.000 | 3.875 | 1.625 | +2.250 | ||||||
| Camberwell | 7 | 1 | 0.143 | 57% | 43% | 1.714 | 4.000 | 1.714 | +2.286 | |||||||
| Altona | 6 | 1 | 0.167 | 50% | 17% | 33% | 1.667 | 4.333 | 2.333 | +2.000 | ||||||
| Werribee | 6 | 3 | 0.500 | 83% | 17% | 2.667 | 5.667 | 0.667 | +5.000 | |||||||
| Old Melburnians | 4 | 1 | 0.250 | 25% | 25% | 50% | 1.000 | 1.750 | 2.500 | -0.750 | ||||||
| Hawthorn | 3 | 1 | 0.333 | 100% | 3.000 | 10.667 | 0.000 | +10.667 | ||||||||
| MUHC | 3 | 1 | 0.333 | 67% | 33% | 2.000 | 6.000 | 3.333 | +2.667 | |||||||
| Box Hill | 3 | 33% | 67% | 1.000 | 1.667 | 2.667 | -1.000 | |||||||||
| Sth. Knights | 3 | 67% | 33% | 0.667 | 2.000 | 3.000 | -1.000 | |||||||||
| Casey | 3 | 33% | 33% | 33% | 1.333 | 2.000 | 2.000 | +0.000 | ||||||||
| Ballarat | 3 | 33% | 67% | 1.000 | 1.000 | 2.333 | -1.333 | |||||||||
| St.Bedes | 3 | 33% | 67% | 1.000 | 1.333 | 3.000 | -1.667 | |||||||||
| Reservoir | 2 | 50% | 50% | 2.000 | 2.000 | 0.500 | +1.500 | |||||||||
| Kew | 2 | 50% | 50% | 2.000 | 4.000 | 0.000 | +4.000 | |||||||||
| MHSOB | 2 | 2 | 1.000 | 100% | 3.000 | 15.500 | 0.000 | +15.500 | ||||||||
| Waverley | 2 | 2 | 1.000 | 100% | 3.000 | 8.500 | 0.500 | +8.000 | ||||||||
| Sandringham | 2 | 1 | 0.500 | 100% | 3.000 | 8.000 | 1.500 | +6.500 | ||||||||
| Eastern | 2 | 50% | 50% | 1.500 | 3.000 | 1.500 | +1.500 | |||||||||
| SNP | 2 | 2 | 1.000 | 100% | 3.000 | 7.000 | 0.500 | +6.500 | ||||||||
| Melton | 2 | 1 | 0.500 | 100% | 3.000 | 3.500 | 1.000 | +2.500 | ||||||||
| Baw-Baw | 2 | 100% | 0.000 | 1.500 | 5.500 | -4.000 | ||||||||||
| Old Xaverians | 2 | 100% | 0.000 | 2.000 | 4.000 | -2.000 | ||||||||||
| Ajax-Maccabi | 2 | 50% | 50% | 1.500 | 1.500 | 1.500 | +0.000 | |||||||||
| Trinity | 2 | 3 | 1.500 | 50% | 50% | 1.500 | 3.500 | 1.500 | +2.000 | |||||||
| Doncaster | 1 | 100% | 1.000 | 3.000 | 3.000 | +0.000 | ||||||||||
| TEM | 1 | 1 | 1.000 | 100% | 3.000 | 6.000 | 2.000 | +4.000 | ||||||||
| Old Carey | 1 | 100% | 3.000 | 6.000 | 1.000 | +5.000 | ||||||||||
| Old Haileybury | 1 | 1 | 1.000 | 100% | 3.000 | 6.000 | 1.000 | +5.000 | ||||||||
| Swinburne | 1 | 100% | 3.000 | 5.000 | 1.000 | +4.000 | ||||||||||
| Collegians-X | 1 | 100% | 3.000 | 3.000 | 2.000 | +1.000 | ||||||||||
| Geelong | 1 | 100% | 3.000 | 2.000 | 1.000 | +1.000 | ||||||||||
| St.Bernards | 1 | 100% | 3.000 | 4.000 | 3.000 | +1.000 | ||||||||||
| Chadstone | 1 | 100% | 0.000 | 2.000 | 3.000 | -1.000 | ||||||||||
| Opponents :39 | 158 | 41 | 0.259 | 52% | 13% | 35% | 1.684 | 3.449 | 2.082 | +1.367 |
Playing Venues
| Venue | Games |
Goals | Avge. |
Win % | Draw % | Loss % | Unkn % | Avge. Points |
Avge. For | Avge. Aga | Avge. Diff. |
G.K. Games | Shut- outs | Shut- out % | Goals In | Goals Avge. |
|---|---|---|---|---|---|---|---|---|---|---|---|---|---|---|---|---|
| Melton Mowbray | 56 | 18 | 0.321 | 66% | 7% | 27% | 2.054 | 4.018 | 1.732 | +2.286 | ||||||
| Footscray | 43 | 12 | 0.279 | 37% | 21% | 42% | 1.326 | 2.209 | 2.140 | +0.070 | ||||||
| Altona Indoor | 10 | 40% | 60% | 1.200 | 5.200 | 5.500 | -0.300 | |||||||||
| Hawthorn | 6 | 1 | 0.167 | 67% | 33% | 2.000 | 5.833 | 1.833 | +4.000 | |||||||
| Essendon | 5 | 40% | 20% | 40% | 1.400 | 2.200 | 1.800 | +0.400 | ||||||||
| Greensborough | 4 | 50% | 50% | 1.500 | 2.000 | 1.500 | +0.500 | |||||||||
| SHC | 4 | 50% | 50% | 1.500 | 2.750 | 1.500 | +1.250 | |||||||||
| Yarra Velodrome | 3 | 1 | 0.333 | 67% | 33% | 2.000 | 5.333 | 1.000 | +4.333 | |||||||
| Dandenong | 3 | 1 | 0.333 | 33% | 33% | 33% | 1.333 | 3.333 | 2.000 | +1.333 | ||||||
| Yarra Valley | 3 | 1 | 0.333 | 67% | 33% | 2.000 | 3.333 | 2.000 | +1.333 | |||||||
| Werribee | 3 | 67% | 33% | 2.333 | 4.000 | 1.000 | +3.000 | |||||||||
| Reservoir | 2 | 100% | 3.000 | 2.000 | 0.000 | +2.000 | ||||||||||
| Melbourne High | 2 | 2 | 1.000 | 100% | 3.000 | 11.500 | 2.000 | +9.500 | ||||||||
| Altona | 2 | 50% | 50% | 0.500 | 1.000 | 1.500 | -0.500 | |||||||||
| PEGS | 2 | 1 | 0.500 | 50% | 50% | 0.500 | 2.000 | 2.500 | -0.500 | |||||||
| Berwick | 2 | 50% | 50% | 0.500 | 2.000 | 3.000 | -1.000 | |||||||||
| Doncaster | 1 | 100% | 1.000 | 3.000 | 3.000 | +0.000 | ||||||||||
| Waverley | 1 | 2 | 2.000 | 100% | 3.000 | 7.000 | 1.000 | +6.000 | ||||||||
| Albert Park | 1 | 100% | 3.000 | 1.000 | 1.000 | +0.000 | ||||||||||
| Haileybury | 1 | 1 | 1.000 | 100% | 3.000 | 6.000 | 1.000 | +5.000 | ||||||||
| Melb Grammar | 1 | 100% | 0.000 | 0.000 | 3.000 | -3.000 | ||||||||||
| Ballarat | 1 | 100% | 0.000 | 2.000 | 4.000 | -2.000 | ||||||||||
| Mentone | 1 | 100% | 3.000 | 2.000 | 1.000 | +1.000 | ||||||||||
| Trinity | 1 | 1 | 1.000 | 100% | 0.000 | 2.000 | 3.000 | -1.000 | ||||||||
| Venues :24 | 158 | 41 | 0.259 | 52% | 13% | 35% | 1.684 | 3.449 | 2.082 | +1.367 |