 |
Melton Hockey Club |
|
Last updated : 9:32 am - 2 November 2023
Club Cap : 586
(Games : 165, Goals : 13 )
Milestones
| 2004-Apr-16 : | First game (Melton 1 drew St.Bernards 1. R-01: 2004 U15 North) |
| 2004-Apr-23 : | First goal scored (Melton 4 def. Camberwell 0. R-02: 2004 U15 North) |
| 2006-Jun-16 : | 50 Junior games (Melton 3 def. Yarra Valley 0. R-08: 2006 U17 North) |
| 2006-Sep-01 : | Last Junior game (Melton 5 def. Werribee 0. R-18: 2006 U17 North) |
| 2007-Apr-22 : | First Senior game (Melton 3 drew MUHC (A) 3. R-01: 2007 Metro 4 West Men) |
| 2010-May-15 : | First Senior goal (St.Bernards 3 def. Melton 2. R-05: 2010 Metro 3 West Men) |
| 2014-Jul-12 : | Last game played (Melton 2 def. PEGS 1. R-11: 2014 Metro 3 West Men) |
| Playing career : 3739 days. (10 years and 89 days.) |
Honours, Trophies, and Official Roles
| Best Clubperson : | 2010/11 |
| Coach's Award : | 2012-Metro 2 West Men |
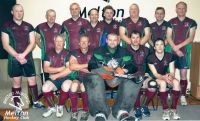
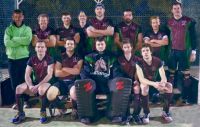
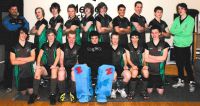
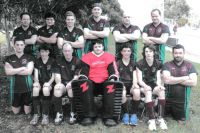
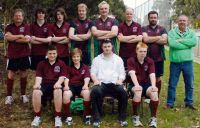
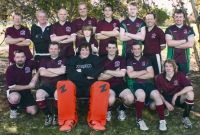
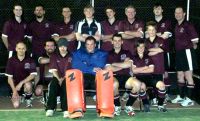
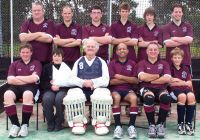
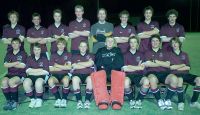
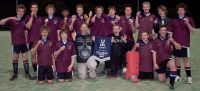
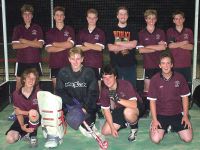
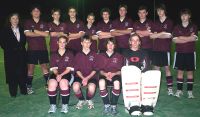
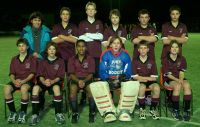
Team Photographs
Complete Playing History
Teams played with : 19
Premierships won : 0
Wooden Spoons : 2
| Games as Player |
Games Won | Games Drawn | Games Lost | Total | Goals | Goalscoring Average |
|---|---|---|---|---|---|---|
| Junior Winter | 23 | 9 | 18 | 50 | 7 | 0.140 |
| Junior Summer | 5 | 0 | 3 | 8 | 0 | 0.000 |
| Junior Total | 28 | 9 | 21 | 58 | 7 | 0.121 |
| Senior Winter | 27 | 12 | 66 | 105 | 6 | 0.057 |
| Senior Summer | 0 | 0 | 2 | 2 | 0 | 0.000 |
| Senior Total | 27 | 12 | 68 | 107 | 6 | 0.056 |
| Total | 55 | 21 | 89 | 165 | 13 | 0.079 |
| Pos. | PR/WS | Div. | Competition | Games | Goals | Avge. | Won | Drawn | Lost | Avge.For | Avge.Aga | Avge.Diff | G.For | G.Aga | GoalDiff |
|---|---|---|---|---|---|---|---|---|---|---|---|---|---|---|---|
| 6 | 2014 Metro 3 West Men* | 9 | 4 | 1 | 4 | 2.444 | 2.222 | +0.222 | 22 | 20 | +002 | ||||
| 7 | 2013 Vic League 3 Res. Men* | 4 | 2 | 1 | 1 | 3.000 | 3.250 | -0.250 | 12 | 13 | -001 | ||||
| 3 | 2013 Metro 3 West (M)* | 9 | 2 | 0.222 | 6 | 2 | 1 | 2.778 | 1.333 | +1.444 | 25 | 12 | +013 | ||
| 5 | 2013 Metro 3 West (B)* | 5 | 1 | 0.200 | 1 | 4 | 1.200 | 5.800 | -4.600 | 6 | 29 | -023 | |||
| ? | WS | 2012/13 Footscray Summer | 2 | 2 | 1.000 | 6.000 | -5.000 | 2 | 12 | -010 | |||||
| 9 | 2012 Metro 2 West Men* | 14 | 1 | 0.071 | 2 | 2 | 10 | 1.500 | 3.857 | -2.357 | 21 | 54 | -033 | ||
| 9 | 2012 Metro 3 West Men* | 6 | 1 | 5 | 1.500 | 4.667 | -3.167 | 9 | 28 | -019 | |||||
| 3 | 2011 Metro 2 West Men* | 2 | 1 | 1 | 2.500 | 1.000 | +1.500 | 5 | 2 | +003 | |||||
| 9 | 2011 Metro 3 West Men* | 15 | 1 | 0.067 | 3 | 1 | 11 | 1.533 | 4.000 | -2.467 | 23 | 60 | -037 | ||
| 7 | 2010 Metro 3 West Men* | 15 | 1 | 0.067 | 3 | 1 | 11 | 1.733 | 5.133 | -3.400 | 26 | 77 | -051 | ||
| 7 | 2009 Metro 3 West Men* | 3 | 1 | 2 | 1.000 | 2.000 | -1.000 | 3 | 6 | -003 | |||||
| 9 | 2008 Metro 3 West Men* | 7 | 1 | 6 | 1.714 | 6.857 | -5.143 | 12 | 48 | -036 | |||||
| 3 | 2007 Metro 2 West Men* | 1 | 1 | 1.000 | 0.000 | +1.000 | 1 | 0 | +001 | ||||||
| 5 | 2007 Metro 3 West Men* | 2 | 1 | 1 | 1.000 | 0.500 | +0.500 | 2 | 1 | +001 | |||||
| 9 | 2007 Metro 4 West Men* | 13 | 2 | 1 | 10 | 1.385 | 5.846 | -4.462 | 18 | 76 | -058 | ||||
| 1 | 2006 U17 North* | 14 | 9 | 3 | 2 | 2.500 | 0.857 | +1.643 | 35 | 12 | +023 | ||||
| 3 | 2005/06 U17 Essendon Friday* | 8 | 5 | 3 | 4.000 | 2.000 | +2.000 | 32 | 16 | +016 | |||||
| 8 | WS | 2005 U17 North* | 17 | 3 | 2 | 12 | 0.941 | 3.235 | -2.294 | 16 | 55 | -039 | |||
| 3 | 2004 U15 North* | 19 | 7 | 0.368 | 11 | 4 | 4 | 2.474 | 1.000 | +1.474 | 47 | 19 | +028 | ||
| 165 | 13 | 0.079 | 55 | 21 | 89 | 2.032 | 3.273 | -1.352 | 317 | 540 | -223 |
Junior Winter Playing History
| Games as Player |
Games Won | Games Drawn | Games Lost | Total | Goals | Goalscoring Average |
|---|---|---|---|---|---|---|
| Junior Winter | 23 | 9 | 18 | 50 | 7 | 0.140 |
| First Game : | Melton 1 drew St.Bernards 1. R-01: 2004 U15 North |
| Last Game : | Melton 5 def. Werribee 0. R-18: 2006 U17 North |
| Best Win : | Melton 6 def. MCC 0. R-15: 2006 U17 North |
| Worst Loss : | Camberwell 12 def. Melton 1. R-03: 2005 U17 North |
| 1 goal games : | 7 times. Last : Melton 3 def. Yarra Valley 2. R-18: 2004 U15 North |
| Finals : | TEM (L) 2 def. Melton 0. SF: 2004 U15 North |
| Premierships : | None. |
Junior Summer Playing History
| Games as Player |
Games Won | Games Drawn | Games Lost | Total | Goals | Goalscoring Average |
|---|---|---|---|---|---|---|
| Junior Summer | 5 | 0 | 3 | 8 | 0 | 0.000 |
| First Game : | Essendon (F) 3 def. Melton 2. R-01: 2005/06 U17 Essendon Friday |
| Last Game : | Melton 5 def. Essendon (L) 3. R-10: 2005/06 U17 Essendon Friday |
| Best Win : | Melton 7 def. Footscray 0. R-06: 2005/06 U17 Essendon Friday |
| Worst Loss : | Essendon (F) 4 def. Melton 1. R-08: 2005/06 U17 Essendon Friday |
| Finals : | None. |
| Premierships : | None. |
Senior Winter Playing History
| Games as Player |
Games Won | Games Drawn | Games Lost | Total | Goals | Goalscoring Average |
|---|---|---|---|---|---|---|
| Senior Winter | 27 | 12 | 66 | 105 | 6 | 0.057 |
| First Game : | Melton 3 drew MUHC (A) 3. R-01: 2007 Metro 4 West Men |
| Last Game : | Melton 2 def. PEGS 1. R-11: 2014 Metro 3 West Men |
| Best Win : | Melton 10 def. St.Bernards 1. R-14: 2010 Metro 3 West Men |
| Worst Loss : | Powerhouse 14 def. Melton 0. R-17: 2010 Metro 3 West Men |
| 1 goal games : | 6 times. Last : Melton 4 drew Footscray (R) 4. R-15: 2013 Metro 3 West (B) |
| Finals : | Melton 8 def. Footscray (R) 1. EF: 2013 Metro 3 West (M) Werribee (B) 3 def. Melton 1. PF: 2013 Metro 3 West (M) |
| Premierships : | None. |
Senior Summer Playing History
| Games as Player |
Games Won | Games Drawn | Games Lost | Total | Goals | Goalscoring Average |
|---|---|---|---|---|---|---|
| Senior Summer | 0 | 0 | 2 | 2 | 0 | 0.000 |
| First Game : | Footscray (R) 5 def. Melton 1. R-01: 2012/13 Footscray Summer |
| Last Game : | Footscray (B) 7 def. Melton 1. R-07: 2012/13 Footscray Summer |
| Worst Loss : | Footscray (B) 7 def. Melton 1. R-07: 2012/13 Footscray Summer |
| Finals : | None. |
| Premierships : | None. |
Teammates
Number of teammates :128
| Player |
Games |
Win % | Draw % | Loss % | Unkn % | Avge. Points |
Avge. For | Avge. Aga | Avge. Diff. |
|---|---|---|---|---|---|---|---|---|---|
| Clough, Jarryd* | 83 | 35% | 14% | 51% | 1.193 | 1.819 | 2.602 | -0.783 | |
| Downs, Andrew* | 68 | 47% | 15% | 38% | 1.559 | 2.353 | 1.956 | +0.397 | |
| Haycock, John* | 66 | 20% | 12% | 68% | 0.712 | 1.394 | 3.864 | -2.470 | |
| Spence, Adam* | 56 | 48% | 14% | 38% | 1.589 | 2.321 | 1.786 | +0.536 | |
| Kovarik, Hans* | 53 | 23% | 8% | 70% | 0.755 | 1.660 | 4.094 | -2.434 | |
| Simpson, Matthew* | 53 | 30% | 9% | 60% | 1.000 | 1.868 | 3.585 | -1.717 | |
| Strebs-Stelps, Leo* | 49 | 24% | 6% | 69% | 0.796 | 1.755 | 4.449 | -2.694 | |
| Noonan, Kristian* | 43 | 56% | 19% | 26% | 1.860 | 2.558 | 1.233 | +1.326 | |
| Knipe, Lucas* | 43 | 23% | 9% | 67% | 0.791 | 1.744 | 4.186 | -2.442 | |
| Buttigieg, William* | 40 | 38% | 15% | 48% | 1.275 | 1.700 | 2.700 | -1.000 | |
| Agius, Jesse* | 39 | 44% | 15% | 41% | 1.462 | 2.308 | 1.872 | +0.436 | |
| Arnold, David* | 39 | 18% | 10% | 72% | 0.641 | 1.564 | 4.359 | -2.795 | |
| McMurrie, Michael* | 38 | 24% | 11% | 66% | 0.816 | 1.632 | 3.947 | -2.316 | |
| Mumford, Matthew* | 37 | 57% | 22% | 22% | 1.919 | 2.486 | 1.243 | +1.243 | |
| Thomas, Joshua* | 36 | 39% | 17% | 44% | 1.333 | 1.750 | 2.056 | -0.306 | |
| Hocking, Branton* | 35 | 49% | 14% | 37% | 1.600 | 2.200 | 1.943 | +0.257 | |
| McMurrie, Andrew* | 34 | 35% | 12% | 53% | 1.176 | 1.912 | 4.000 | -2.088 | |
| Downs, Cassandra* | 33 | 36% | 18% | 45% | 1.273 | 1.758 | 1.848 | -0.091 | |
| Baker, Daniel* | 33 | 42% | 15% | 42% | 1.424 | 1.697 | 1.818 | -0.121 | |
| McMurrie, Tom* | 32 | 13% | 6% | 81% | 0.438 | 1.438 | 5.438 | -4.000 | |
| Shadbolt, Ron* | 30 | 23% | 17% | 60% | 0.867 | 1.900 | 3.767 | -1.867 | |
| Cook, Stuart* | 29 | 34% | 3% | 62% | 1.069 | 1.931 | 3.897 | -1.966 | |
| Corban, Malcolm* | 29 | 21% | 21% | 59% | 0.828 | 1.793 | 4.172 | -2.379 | |
| Johnson, Shaun* | 28 | 36% | 18% | 46% | 1.250 | 1.643 | 1.929 | -0.286 | |
| Hosking, Michael* | 27 | 63% | 22% | 15% | 2.111 | 3.111 | 1.037 | +2.074 | |
| Murphy, Mathew* | 27 | 37% | 11% | 52% | 1.222 | 2.222 | 2.778 | -0.556 | |
| Docherty, Benjamin* | 25 | 24% | 4% | 72% | 0.760 | 1.520 | 3.720 | -2.200 | |
| Holahan, Zac* | 24 | 54% | 13% | 33% | 1.750 | 2.708 | 2.125 | +0.583 | |
| Matthews, Ben* | 24 | 63% | 17% | 21% | 2.042 | 3.125 | 1.208 | +1.917 | |
| Lawrence, Geoffrey* | 22 | 23% | 18% | 59% | 0.864 | 1.727 | 3.500 | -1.773 | |
| Crebbin, Jason* | 21 | 43% | 24% | 33% | 1.524 | 2.333 | 2.429 | -0.095 | |
| Kelly, Lee* | 21 | 38% | 14% | 48% | 1.286 | 2.095 | 2.619 | -0.524 | |
| Lawrence, Glenn* | 20 | 30% | 15% | 55% | 1.050 | 1.750 | 3.100 | -1.350 | |
| Sorensen, Steven* | 20 | 35% | 10% | 55% | 1.150 | 2.150 | 3.050 | -0.900 | |
| Bosquet, Dane* | 19 | 58% | 21% | 21% | 1.947 | 2.474 | 1.000 | +1.474 | |
| Strebs-Stelps, Ben* | 17 | 18% | 18% | 65% | 0.706 | 2.000 | 4.353 | -2.353 | |
| Knight, Jason* | 17 | 29% | 24% | 47% | 1.118 | 2.176 | 3.000 | -0.824 | |
| Gati, Nick* | 16 | 63% | 19% | 19% | 2.063 | 2.500 | 0.938 | +1.563 | |
| VellaVanKassel, Nick* | 16 | 25% | 13% | 63% | 0.875 | 2.125 | 4.125 | -2.000 | |
| Hoad, Simon* | 15 | 7% | 93% | 0.200 | 1.267 | 5.733 | -4.467 | ||
| Chisholm, Jack* | 15 | 20% | 7% | 73% | 0.667 | 1.533 | 4.267 | -2.733 | |
| Vallance, Lachlan* | 15 | 13% | 20% | 67% | 0.600 | 1.800 | 3.733 | -1.933 | |
| Self, Ryan* | 14 | 29% | 7% | 64% | 0.929 | 1.071 | 5.214 | -4.143 | |
| Lightley, Pamela* | 13 | 15% | 8% | 77% | 0.538 | 0.769 | 2.923 | -2.154 | |
| Bonney, Michael* | 13 | 62% | 23% | 15% | 2.077 | 2.462 | 0.923 | +1.538 | |
| Strobel, Joshua* | 13 | 15% | 8% | 77% | 0.538 | 1.462 | 5.385 | -3.923 | |
| Miller, Nicholas* | 13 | 15% | 8% | 77% | 0.538 | 1.308 | 4.308 | -3.000 | |
| Clotworthy, Joshua* | 13 | 46% | 15% | 38% | 1.538 | 2.000 | 2.538 | -0.538 | |
| Lawrence, William* | 12 | 17% | 8% | 75% | 0.583 | 1.500 | 5.500 | -4.000 | |
| Molden, Rhys* | 12 | 17% | 8% | 75% | 0.583 | 1.500 | 5.500 | -4.000 | |
| Brierley, John* | 12 | 17% | 83% | 0.500 | 1.417 | 6.000 | -4.583 | ||
| Lawrence, Tony* | 12 | 42% | 8% | 50% | 1.333 | 2.250 | 3.167 | -0.917 | |
| Lawrence, Stephen* | 12 | 25% | 25% | 50% | 1.000 | 2.333 | 3.417 | -1.083 | |
| Bennett, Graeme* | 11 | 27% | 9% | 64% | 0.909 | 1.636 | 4.545 | -2.909 | |
| Bluschke, Glen* | 11 | 9% | 9% | 82% | 0.364 | 1.091 | 6.455 | -5.364 | |
| Abel, Jake* | 11 | 18% | 9% | 73% | 0.636 | 1.364 | 5.909 | -4.545 | |
| Bell, Ray* | 11 | 27% | 9% | 64% | 0.909 | 2.273 | 4.091 | -1.818 | |
| McLaren, Scott* | 11 | 36% | 18% | 45% | 1.273 | 2.091 | 3.091 | -1.000 | |
| Griffiths, Rylee* | 11 | 55% | 9% | 36% | 1.727 | 2.364 | 2.000 | +0.364 | |
| Meehan, James* | 11 | 27% | 27% | 45% | 1.091 | 2.182 | 3.091 | -0.909 | |
| Kovarik, John* | 10 | 10% | 10% | 80% | 0.400 | 1.400 | 6.000 | -4.600 | |
| Salvatore, Aaron* | 10 | 50% | 30% | 20% | 1.800 | 3.000 | 2.000 | +1.000 | |
| Currie, Fraser* | 10 | 60% | 10% | 30% | 1.900 | 2.700 | 1.800 | +0.900 | |
| James, William* | 10 | 30% | 10% | 60% | 1.000 | 1.700 | 3.300 | -1.600 | |
| Knight, Tristan* | 10 | 40% | 10% | 50% | 1.300 | 2.100 | 3.400 | -1.300 | |
| MacKinnon, Tim* | 9 | 22% | 11% | 67% | 0.778 | 1.444 | 5.000 | -3.556 | |
| Falcao, Hip* | 9 | 22% | 78% | 0.667 | 1.333 | 6.444 | -5.111 | ||
| Vallance, Liam* | 9 | 22% | 11% | 67% | 0.778 | 1.778 | 5.222 | -3.444 | |
| Kelly, Bo* | 9 | 33% | 67% | 1.000 | 2.333 | 5.222 | -2.889 | ||
| Shelly-Robbins, James* | 9 | 56% | 11% | 33% | 1.778 | 2.778 | 1.667 | +1.111 | |
| Gorton, David* | 9 | 44% | 22% | 33% | 1.556 | 2.667 | 3.333 | -0.667 | |
| Lang, Joshua* | 8 | 75% | 25% | 2.500 | 2.750 | 0.500 | +2.250 | ||
| Bluschke, Mark* | 8 | 13% | 88% | 0.375 | 0.875 | 6.875 | -6.000 | ||
| Hooley, Aidan* | 8 | 13% | 88% | 0.125 | 0.875 | 7.500 | -6.625 | ||
| Patterson, Dylan | 8 | 50% | 13% | 38% | 1.625 | 2.500 | 2.125 | +0.375 | |
| Slocombe, Morgan* | 7 | 43% | 57% | 1.286 | 1.571 | 3.571 | -2.000 | ||
| Hobbs, Neil* | 7 | 14% | 86% | 0.429 | 1.714 | 6.857 | -5.143 | ||
| VellaVanKassel, Chris* | 7 | 29% | 14% | 57% | 1.000 | 1.857 | 2.714 | -0.857 | |
| Lawrence, Jesse* | 7 | 43% | 14% | 43% | 1.429 | 2.571 | 3.000 | -0.429 | |
| Purdie, Samantha* | 5 | 40% | 60% | 1.200 | 1.000 | 3.200 | -2.200 | ||
| Cameron, John* | 5 | 20% | 20% | 60% | 0.800 | 1.600 | 2.800 | -1.200 | |
| Moroney, Jason | 5 | 100% | 0.000 | 0.800 | 5.200 | -4.400 | |||
| Baxter, Peter* | 5 | 40% | 60% | 1.200 | 2.200 | 2.600 | -0.400 | ||
| Hanley-Wood, Ben* | 4 | 25% | 25% | 50% | 1.000 | 2.500 | 2.750 | -0.250 | |
| Arnold, Chris* | 4 | 75% | 25% | 2.250 | 2.250 | 1.500 | +0.750 | ||
| Gill, Jack | 4 | 25% | 25% | 50% | 1.000 | 1.500 | 3.500 | -2.000 | |
| Hosking, Robert* | 4 | 50% | 50% | 1.500 | 4.250 | 2.000 | +2.250 | ||
| May, Adrian* | 4 | 25% | 75% | 0.250 | 0.750 | 6.750 | -6.000 | ||
| Eastwell, Josh* | 4 | 50% | 25% | 25% | 1.750 | 3.000 | 3.000 | +0.000 | |
| Logan, David | 4 | 25% | 75% | 0.750 | 2.250 | 3.250 | -1.000 | ||
| Fawcett, Tom* | 4 | 100% | 0.000 | 1.250 | 3.250 | -2.000 | |||
| James, Jeff* | 4 | 25% | 75% | 0.250 | 1.000 | 6.500 | -5.500 | ||
| Anderson, Matthew* | 3 | 33% | 67% | 1.000 | 2.000 | 7.667 | -5.667 | ||
| Murphy, Craig* | 3 | 33% | 67% | 0.333 | 1.000 | 2.000 | -1.000 | ||
| Lawrence, Richard* | 3 | 33% | 67% | 0.333 | 1.000 | 1.667 | -0.667 | ||
| Gray, Deane | 3 | 100% | 0.000 | 0.667 | 5.000 | -4.333 | |||
| Humphrey, Hayden | 3 | 100% | 0.000 | 0.667 | 4.000 | -3.333 | |||
| McMillan, Brent* | 3 | 67% | 33% | 2.000 | 3.000 | 3.333 | -0.333 | ||
| Thomas, Liam* | 2 | 50% | 50% | 1.500 | 1.500 | 1.000 | +0.500 | ||
| Dine, Brenton* | 2 | 50% | 50% | 1.500 | 2.500 | 6.500 | -4.000 | ||
| Darcy, Astin* | 2 | 50% | 50% | 1.500 | 1.000 | 0.500 | +0.500 | ||
| Rodrigues, Errol* | 2 | 100% | 3.000 | 2.000 | 0.500 | +1.500 | |||
| Spence, Dion* | 2 | 50% | 50% | 1.500 | 1.000 | 0.500 | +0.500 | ||
| Anderson, Steven | 2 | 50% | 50% | 1.500 | 2.000 | 4.000 | -2.000 | ||
| Grant-Taylor, Sandy* | 2 | 100% | 0.000 | 0.000 | 4.500 | -4.500 | |||
| Stanyer, Adrian* | 2 | 50% | 50% | 0.500 | 1.500 | 2.000 | -0.500 | ||
| Arnold, Andrew* | 2 | 100% | 0.000 | 1.000 | 6.000 | -5.000 | |||
| O`Brien, Melissa* | 2 | 100% | 0.000 | 1.000 | 6.000 | -5.000 | |||
| McCann, Matthew* | 1 | 100% | 0.000 | 1.000 | 4.000 | -3.000 | |||
| Spence, Jessica* | 1 | 100% | 0.000 | 1.000 | 12.000 | -11.000 | |||
| Kovas, Tim | 1 | 100% | 0.000 | 0.000 | 3.000 | -3.000 | |||
| Baker, Gavin* | 1 | 100% | 3.000 | 1.000 | 0.000 | +1.000 | |||
| Bluschke, Alf* | 1 | 100% | 3.000 | 1.000 | 0.000 | +1.000 | |||
| Greed, Justin* | 1 | 100% | 3.000 | 1.000 | 0.000 | +1.000 | |||
| Granville, Alan* | 1 | 100% | 0.000 | 0.000 | 8.000 | -8.000 | |||
| Cautley, Mark* | 1 | 100% | 0.000 | 5.000 | 7.000 | -2.000 | |||
| Lawrence, Daryl* | 1 | 100% | 0.000 | 2.000 | 9.000 | -7.000 | |||
| Williams, Mark* | 1 | 100% | 0.000 | 2.000 | 9.000 | -7.000 | |||
| Downs, David* | 1 | 100% | 3.000 | 4.000 | 1.000 | +3.000 | |||
| Kasprzak, Marcus* | 1 | 100% | 1.000 | 2.000 | 2.000 | +0.000 | |||
| Nadaraja, Derick | 1 | 100% | 1.000 | 1.000 | 1.000 | +0.000 | |||
| Moroney, James* | 1 | 100% | 3.000 | 4.000 | 2.000 | +2.000 | |||
| Phillips, Chad* | 1 | 100% | 0.000 | 1.000 | 2.000 | -1.000 | |||
| James, Kylie-Faye* | 1 | 100% | 0.000 | 1.000 | 6.000 | -5.000 | |||
| Brazil, Sean* | 1 | 100% | 0.000 | 1.000 | 5.000 | -4.000 | |||
| James, Daniel* | 1 | 100% | 0.000 | 0.000 | 9.000 | -9.000 | |||
| McMillan, Roger | 1 | 100% | 0.000 | 0.000 | 9.000 | -9.000 | |||
| Berns, Alannah* | 1 | 100% | 0.000 | 0.000 | 8.000 | -8.000 |
Opposition Teams
| Opponent |
Games |
Goals | Avge |
Win % | Draw % | Loss % | Unkn % | Avge. Points |
Avge. For | Avge. Aga | Avge. Diff. |
G.K. Games | Shut- outs | Shut- out % | Goals In | Goals Avge |
|---|---|---|---|---|---|---|---|---|---|---|---|---|---|---|---|---|
| Footscray | 23 | 2 | 0.087 | 39% | 17% | 43% | 1.348 | 2.217 | 2.870 | -0.652 | ||||||
| Essendon | 18 | 44% | 6% | 50% | 1.389 | 2.111 | 2.833 | -0.722 | ||||||||
| Werribee | 15 | 27% | 13% | 60% | 0.933 | 1.600 | 3.467 | -1.867 | ||||||||
| St.Bernards | 12 | 2 | 0.167 | 33% | 8% | 58% | 1.083 | 2.750 | 3.500 | -0.750 | ||||||
| Altona | 10 | 20% | 10% | 70% | 0.700 | 1.400 | 3.600 | -2.200 | ||||||||
| Brunswick | 10 | 30% | 10% | 60% | 1.000 | 1.800 | 4.200 | -2.400 | ||||||||
| MUHC | 9 | 11% | 89% | 0.111 | 0.444 | 5.444 | -5.000 | |||||||||
| RMIT | 8 | 2 | 0.250 | 38% | 13% | 50% | 1.250 | 2.375 | 2.625 | -0.250 | ||||||
| Yarra Valley | 7 | 1 | 0.143 | 29% | 43% | 29% | 1.286 | 1.571 | 2.571 | -1.000 | ||||||
| Greensborough | 7 | 29% | 14% | 57% | 1.000 | 1.429 | 3.000 | -1.571 | ||||||||
| Powerhouse | 6 | 50% | 50% | 1.500 | 1.500 | 4.167 | -2.667 | |||||||||
| Camberwell | 5 | 2 | 0.400 | 20% | 80% | 0.600 | 1.200 | 5.400 | -4.200 | |||||||
| Waverley | 5 | 1 | 0.200 | 60% | 40% | 1.800 | 3.200 | 1.800 | +1.400 | |||||||
| TEM | 5 | 2 | 0.400 | 40% | 20% | 40% | 1.400 | 2.200 | 1.200 | +1.000 | ||||||
| PEGS | 5 | 40% | 20% | 40% | 1.400 | 1.400 | 3.400 | -2.000 | ||||||||
| Latrobe Uni | 4 | 100% | 0.000 | 0.500 | 5.750 | -5.250 | ||||||||||
| Old Melburnians | 4 | 50% | 50% | 1.500 | 4.000 | 4.250 | -0.250 | |||||||||
| Kew | 3 | 100% | 0.000 | 0.667 | 2.667 | -2.000 | ||||||||||
| Box Hill | 2 | 100% | 3.000 | 3.500 | 1.000 | +2.500 | ||||||||||
| MCC | 2 | 50% | 50% | 2.000 | 4.000 | 1.000 | +3.000 | |||||||||
| Doncaster | 1 | 100% | 0.000 | 0.000 | 1.000 | -1.000 | ||||||||||
| Hawthorn | 1 | 100% | 1.000 | 1.000 | 1.000 | +0.000 | ||||||||||
| Collegians-X | 1 | 100% | 3.000 | 5.000 | 1.000 | +4.000 | ||||||||||
| Swinburne | 1 | 100% | 1.000 | 3.000 | 3.000 | +0.000 | ||||||||||
| Melton | 1 | 1 | 1.000 | 100% | 3.000 | 2.000 | 0.000 | +2.000 | ||||||||
| Opponents :25 | 165 | 13 | 0.079 | 33% | 13% | 54% | 1.127 | 1.921 | 3.273 | -1.352 |
Playing Venues
| Venue | Games |
Goals | Avge. |
Win % | Draw % | Loss % | Unkn % | Avge. Points |
Avge. For | Avge. Aga | Avge. Diff. |
G.K. Games | Shut- outs | Shut- out % | Goals In | Goals Avge. |
|---|---|---|---|---|---|---|---|---|---|---|---|---|---|---|---|---|
| Melton Mowbray | 76 | 9 | 0.118 | 45% | 13% | 42% | 1.474 | 2.303 | 2.816 | -0.513 | ||||||
| Essendon | 19 | 37% | 5% | 58% | 1.158 | 2.316 | 3.263 | -0.947 | ||||||||
| Footscray | 11 | 1 | 0.091 | 36% | 64% | 1.091 | 1.727 | 4.000 | -2.273 | |||||||
| Werribee | 8 | 13% | 13% | 75% | 0.500 | 0.750 | 3.500 | -2.750 | ||||||||
| St.Bernards | 7 | 1 | 0.143 | 29% | 71% | 0.286 | 1.143 | 3.286 | -2.143 | |||||||
| SHC | 6 | 1 | 0.167 | 17% | 17% | 67% | 0.667 | 1.333 | 5.667 | -4.333 | ||||||
| Altona | 4 | 25% | 75% | 0.250 | 0.750 | 3.750 | -3.000 | |||||||||
| Reservoir | 4 | 25% | 25% | 50% | 1.000 | 1.250 | 3.000 | -1.750 | ||||||||
| Melbourne Uni | 4 | 100% | 0.000 | 0.000 | 5.750 | -5.750 | ||||||||||
| Hawthorn | 3 | 67% | 33% | 0.667 | 1.000 | 1.333 | -0.333 | |||||||||
| Melbourne High | 3 | 33% | 67% | 1.000 | 2.000 | 3.000 | -1.000 | |||||||||
| Elgar Park | 3 | 33% | 67% | 1.000 | 1.667 | 2.000 | -0.333 | |||||||||
| PEGS | 3 | 33% | 33% | 33% | 1.333 | 1.667 | 3.333 | -1.667 | ||||||||
| Melb Grammar | 3 | 33% | 67% | 1.000 | 4.000 | 5.333 | -1.333 | |||||||||
| Brunswick | 3 | 33% | 67% | 1.000 | 2.000 | 4.000 | -2.000 | |||||||||
| Monash | 2 | 1 | 0.500 | 50% | 50% | 1.500 | 3.000 | 1.500 | +1.500 | |||||||
| Albert Park | 2 | 50% | 50% | 1.500 | 1.000 | 4.000 | -3.000 | |||||||||
| Greensborough | 2 | 100% | 0.000 | 0.500 | 4.000 | -3.500 | ||||||||||
| Yarra Valley | 1 | 100% | 1.000 | 3.000 | 3.000 | +0.000 | ||||||||||
| PSF | 1 | 100% | 0.000 | 0.000 | 6.000 | -6.000 | ||||||||||
| Venues :20 | 165 | 13 | 0.079 | 33% | 13% | 54% | 1.127 | 1.921 | 3.273 | -1.352 |