 |
Melton Hockey Club |
|
Last updated : 10:18 am - 2 November 2023
Club Cap : 335
(Games : 108, Goals : 1 )
First XI Men's Cap : 84
(Games : 30, Goals : 0)
Milestones
| 1993-Mar-27 : | First Junior game (Melton 2 def. Kealba 1. R-01: 1993 U17 North) |
| 1993-Mar-27 : | First game (Melton 2 def. Kealba 1. R-01: 1993 U17 North) |
| 1994-Jul-10 : | First Senior game (Brunswick 2 def. Melton 0. R-11: 1994 Metro 2 West Men) |
| 1995-Aug-11 : | Last Junior game (Melton 13 def. Greensborough 0. R-18: 1995 U17 North) |
| 1995-Aug-11 : | First goal scored (Melton 13 def. Greensborough 0. R-18: 1995 U17 North) |
| 1998-Apr-05 : | First First XI Mens game (Kew 9 def. Melton 3. R-01: 1998 Metro 1 West Men) |
| 2000-Jul-15 : | Last First XI Mens game played (Melton 2 def. Casey 1. R-15: 2000 State League 4 Men) |
| 2000-Jul-15 : | Last game played (Melton 2 def. Casey 1. R-15: 2000 State League 4 Men) |
| Playing career : 2667 days. (7 years and 112 days.) |
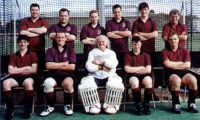
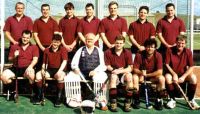
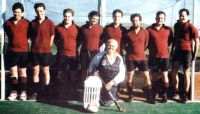
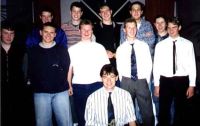
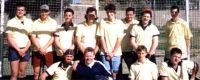
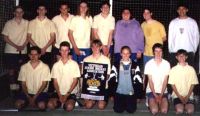
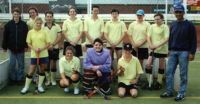
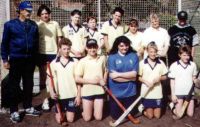
Team Photographs
Complete Playing History
Teams played with : 11
Premierships won : 1
Wooden Spoons : 0
| Games as Player |
Games Won | Games Drawn | Games Lost | Total | Goals | Goalscoring Average |
|---|---|---|---|---|---|---|
| Junior Winter | 32 | 2 | 6 | 40 | 1 | 0.026 |
| Senior Winter | 22 | 6 | 31 | 59 | 0 | 0.000 |
| Senior Summer | 2 | 0 | 7 | 9 | 0 | 0.000 |
| Senior Total | 24 | 6 | 38 | 68 | 0 | 0.000 |
| Total | 56 | 8 | 44 | 108 | 1 | 0.009 |
| Pos. | PR/WS | Div. | Competition | Games | Goals | Avge. | Won | Drawn | Lost | Avge.For | Avge.Aga | Avge.Diff | G.For | G.Aga | GoalDiff |
|---|---|---|---|---|---|---|---|---|---|---|---|---|---|---|---|
| 9 | 2000 State League 4 Men* | 9 | 4 | 1 | 4 | 2.111 | 3.667 | -1.556 | 19 | 33 | -014 | ||||
| 8 | 1999 State League 4 Men* | 11 | 2 | 9 | 2.727 | 5.636 | -2.909 | 30 | 62 | -032 | |||||
| 4 | 1998 Metro 1 West Men* | 10 | 4 | 1 | 5 | 3.200 | 3.900 | -0.700 | 32 | 39 | -007 | ||||
| 4 | 1997 Metro 3 West Men* | 8 | 5 | 1 | 2 | 5.375 | 2.625 | +2.750 | 43 | 21 | +022 | ||||
| 8 | 1996 Metro 3 West Men* | 1 | 1 | 1.000 | 2.000 | -1.000 | 1 | 2 | -001 | ||||||
| 5 | 1995/96 SHC Sunday Mixed | 9 | 2 | 7 | 2.556 | 7.333 | -4.778 | 23 | 66 | -043 | |||||
| 4 | 1995 Metro 3 West Men* | 16 | 7 | 3 | 6 | 3.000 | 2.063 | +0.938 | 48 | 33 | +015 | ||||
| 3 | 1995 U17 North* | 14 | 1 | 0.071 | 10 | 1 | 3 | 4.357 | 1.214 | +3.143 | 61 | 17 | +044 | ||
| 9 | 1994 Metro 2 West Men* | 4 | 4 | 0.500 | 6.000 | -5.500 | 2 | 24 | -022 | ||||||
| 1 | PR | 1994 U17 North* | 10 | 9 | 1 | 5.600 | 2.100 | +3.500 | 56 | 21 | +035 | ||||
| 2 | 1993 U17 North* | 16 | 13 | 1 | 2 | 3.938 | 0.938 | +3.000 | 63 | 15 | +048 | ||||
| 108 | 1 | 0.009 | 56 | 8 | 44 | 3.818 | 3.083 | +0.417 | 378 | 333 | +045 |
Goalkeeping History
| Games as Goalkeeper |
Games Won | Games Drawn | Games Lost | Total | Goals Against |
G.A. Avg. |
|---|---|---|---|---|---|---|
| Senior Winter | 0 | 0 | 1 | 1 | 3 | 3.000 |
| Pos. | Div. | Competition | Games | Won | Drawn | Lost | Shutouts | % | Goals In | Avge. | GoalDiff |
|---|---|---|---|---|---|---|---|---|---|---|---|
| 4 | 1995 Metro 3 West Men* | 1 | 1 | 0% | 3 | 3.000 | -003 |
Junior Winter Playing History
| Games as Player |
Games Won | Games Drawn | Games Lost | Total | Goals | Goalscoring Average |
|---|---|---|---|---|---|---|
| Junior Winter | 32 | 2 | 6 | 40 | 1 | 0.026 |
| First Game : | Melton 2 def. Kealba 1. R-01: 1993 U17 North |
| Last Game : | Melton 13 def. Greensborough 0. R-18: 1995 U17 North |
| Best Win : | Melton 13 def. Greensborough 0. R-18: 1995 U17 North |
| Worst Loss : | Brunswick 4 def. Melton 1. R-01: 1995 U17 North |
| 1 goal games : | 1 times. Last : Melton 13 def. Greensborough 0. R-18: 1995 U17 North |
| Finals : | Camberwell 2 def. Melton 1. GF: 1993 U17 North Melton 5 def. Altona 1. SF: 1993 U17 North Melton 7 def. Camberwell 5. GF: 1994 U17 North Melton 4 def. Brunswick 1. SF: 1994 U17 North |
| Premierships : | Melton 7 def. Camberwell 5. GF: 1994 U17 North |
Senior Winter Playing History
| Games as Player |
Games Won | Games Drawn | Games Lost | Total | Goals | Goalscoring Average |
|---|---|---|---|---|---|---|
| Senior Winter | 22 | 6 | 31 | 59 | 0 | 0.000 |
| First Game : | Brunswick 2 def. Melton 0. R-11: 1994 Metro 2 West Men |
| Last Game : | Melton 2 def. Casey 1. R-15: 2000 State League 4 Men |
| Best Win : | Melton 10 def. Footscray 1. R-18: 1997 Metro 3 West Men |
| Worst Loss : | Bendigo 15 def. Melton 1. R-16: 1999 State League 4 Men |
| Finals : | PEGS 1 def. Melton 1. SF: 1995 Metro 3 West Men MUHC 2 def. Melton 1. SF: 1997 Metro 3 West Men Camberwell 4 def. Melton 2. SF: 1998 Metro 1 West Men |
| Premierships : | None. |
Senior Summer Playing History
| Games as Player |
Games Won | Games Drawn | Games Lost | Total | Goals | Goalscoring Average |
|---|---|---|---|---|---|---|
| Senior Summer | 2 | 0 | 7 | 9 | 0 | 0.000 |
| First Game : | Essendon 10 def. Melton 0. R-01: 1995/96 SHC Sunday Mixed |
| Last Game : | Melton 8 def. Yarra Valley 3. R-10: 1995/96 SHC Sunday Mixed |
| Best Win : | Melton 8 def. Yarra Valley 3. R-10: 1995/96 SHC Sunday Mixed |
| Worst Loss : | RMIT 13 def. Melton 2. R-08: 1995/96 SHC Sunday Mixed |
| Finals : | None. |
| Premierships : | None. |
Teammates
Number of teammates :60
| Player |
Games |
Win % | Draw % | Loss % | Unkn % | Avge. Points |
Avge. For | Avge. Aga | Avge. Diff. |
|---|---|---|---|---|---|---|---|---|---|
| Lawrence, Stephen* | 75 | 57% | 9% | 33% | 1.813 | 3.827 | 2.653 | +1.173 | |
| Treganowan, Brad* | 69 | 55% | 4% | 41% | 1.696 | 3.594 | 3.203 | +0.391 | |
| Lawrence, Glenn* | 58 | 38% | 10% | 52% | 1.241 | 3.000 | 3.655 | -0.655 | |
| MacKinnon, Tim* | 55 | 47% | 7% | 45% | 1.491 | 3.636 | 2.873 | +0.764 | |
| Kari, Grant* | 47 | 72% | 4% | 23% | 2.213 | 4.298 | 2.255 | +2.043 | |
| Mills, Steven* | 46 | 67% | 4% | 28% | 2.065 | 4.196 | 2.370 | +1.826 | |
| Downs, David* | 44 | 39% | 11% | 50% | 1.273 | 3.000 | 3.409 | -0.409 | |
| Lawrence, Geoffrey* | 43 | 37% | 9% | 53% | 1.209 | 3.209 | 3.442 | -0.233 | |
| Lawrence, Daryl* | 41 | 44% | 12% | 44% | 1.439 | 3.171 | 3.195 | -0.024 | |
| Lawrence, Tony* | 40 | 40% | 13% | 48% | 1.325 | 3.450 | 2.925 | +0.525 | |
| McNair, Anthony* | 40 | 50% | 10% | 40% | 1.600 | 3.500 | 3.125 | +0.375 | |
| Duffy, Craig* | 34 | 68% | 3% | 29% | 2.059 | 3.647 | 2.265 | +1.382 | |
| MacKinnon, Andrew* | 32 | 66% | 9% | 25% | 2.063 | 4.469 | 2.031 | +2.438 | |
| Kovarik, Hans* | 32 | 31% | 6% | 63% | 1.000 | 2.563 | 4.688 | -2.125 | |
| Williams, Mark* | 31 | 74% | 10% | 16% | 2.323 | 4.097 | 1.710 | +2.387 | |
| Sorensen, Steven* | 31 | 48% | 6% | 45% | 1.516 | 3.129 | 3.161 | -0.032 | |
| Shadbolt, Ron* | 30 | 30% | 7% | 63% | 0.967 | 2.333 | 4.567 | -2.233 | |
| Bedggood, Melissa* | 27 | 78% | 4% | 19% | 2.370 | 4.296 | 1.704 | +2.593 | |
| Morritt, Sharon* | 27 | 63% | 4% | 33% | 1.926 | 3.926 | 2.889 | +1.037 | |
| Bedggood, Stephen* | 25 | 52% | 4% | 44% | 1.600 | 3.560 | 3.240 | +0.320 | |
| Lawrence, William* | 23 | 43% | 9% | 48% | 1.391 | 3.522 | 4.130 | -0.609 | |
| Garner, Troy | 22 | 64% | 9% | 27% | 2.000 | 4.455 | 2.227 | +2.227 | |
| Mitchell, Sam | 21 | 57% | 10% | 33% | 1.810 | 3.905 | 1.667 | +2.238 | |
| Spence, Dion* | 20 | 85% | 5% | 10% | 2.600 | 5.450 | 1.500 | +3.950 | |
| Morritt, Tracey* | 16 | 81% | 6% | 13% | 2.500 | 3.938 | 0.938 | +3.000 | |
| Taylor, Leigh | 16 | 81% | 6% | 13% | 2.500 | 3.938 | 0.938 | +3.000 | |
| Treganowan, Daryn* | 15 | 67% | 7% | 27% | 2.067 | 4.200 | 1.533 | +2.667 | |
| Spence, Matthew* | 13 | 69% | 8% | 23% | 2.154 | 4.154 | 1.308 | +2.846 | |
| Harris, Justin | 11 | 27% | 73% | 0.818 | 2.091 | 6.364 | -4.273 | ||
| Trudgen, Brendan | 10 | 80% | 10% | 10% | 2.500 | 4.400 | 0.700 | +3.700 | |
| Powderly, Darryl* | 10 | 40% | 20% | 40% | 1.400 | 3.400 | 3.400 | +0.000 | |
| Cameron, John* | 10 | 40% | 20% | 40% | 1.400 | 2.600 | 1.900 | +0.700 | |
| Granville, Alan* | 9 | 22% | 78% | 0.667 | 2.556 | 7.333 | -4.778 | ||
| Martin, Michelle* | 9 | 22% | 78% | 0.667 | 2.556 | 7.333 | -4.778 | ||
| Williams, Lisa* | 9 | 22% | 78% | 0.667 | 2.556 | 7.333 | -4.778 | ||
| Stanyer, Adrian* | 9 | 44% | 11% | 44% | 1.444 | 2.111 | 3.667 | -1.556 | |
| Powderly, Phillip* | 8 | 50% | 50% | 1.500 | 4.250 | 3.625 | +0.625 | ||
| Bourke, Karen* | 8 | 13% | 88% | 0.375 | 1.875 | 7.875 | -6.000 | ||
| Mills, Helen* | 8 | 13% | 88% | 0.375 | 2.500 | 8.000 | -5.500 | ||
| Graetz, Jeff* | 8 | 38% | 13% | 50% | 1.250 | 2.000 | 3.875 | -1.875 | |
| Hanley-Wood, Ben* | 7 | 43% | 57% | 1.286 | 2.857 | 3.429 | -0.571 | ||
| Townsend, Stephen* | 7 | 43% | 14% | 43% | 1.429 | 3.714 | 3.714 | +0.000 | |
| Irvine, Andrew* | 6 | 17% | 83% | 0.500 | 1.667 | 4.167 | -2.500 | ||
| Downes, Cheryl* | 6 | 33% | 67% | 1.000 | 3.500 | 7.667 | -4.167 | ||
| Casper, Adrian* | 6 | 50% | 17% | 33% | 1.667 | 3.667 | 3.000 | +0.667 | |
| Baker, Gavin* | 6 | 50% | 50% | 1.500 | 2.167 | 3.500 | -1.333 | ||
| Downs, Colleen* | 5 | 20% | 20% | 60% | 0.800 | 2.200 | 4.400 | -2.200 | |
| Crebbin, Jason* | 4 | 50% | 50% | 1.500 | 1.500 | 4.000 | -2.500 | ||
| Lawrence, Richard* | 3 | 100% | 0.000 | 0.667 | 6.000 | -5.333 | |||
| Tucker, David | 3 | 33% | 67% | 0.333 | 1.333 | 5.000 | -3.667 | ||
| Morritt, Earl* | 3 | 100% | 0.000 | 1.000 | 8.000 | -7.000 | |||
| Lewis, Chris* | 2 | 50% | 50% | 1.500 | 2.500 | 1.500 | +1.000 | ||
| Shadbolt, Narelle* | 2 | 50% | 50% | 2.000 | 2.500 | 2.000 | +0.500 | ||
| Dooling, Matthew | 1 | 100% | 3.000 | 3.000 | 0.000 | +3.000 | |||
| Reardon, Janice* | 1 | 100% | 0.000 | 2.000 | 6.000 | -4.000 | |||
| Downes, Lana* | 1 | 100% | 3.000 | 3.000 | 2.000 | +1.000 | |||
| Treganowan, Jason | 1 | 100% | 0.000 | 0.000 | 8.000 | -8.000 | |||
| Govan, Jeff* | 1 | 100% | 0.000 | 1.000 | 2.000 | -1.000 | |||
| Nicholls, James | 1 | 100% | 3.000 | 3.000 | 2.000 | +1.000 | |||
| Hibayshi, Takanori | 1 | 100% | 0.000 | 3.000 | 9.000 | -6.000 |
Opposition Teams
| Opponent |
Games |
Goals | Avge |
Win % | Draw % | Loss % | Unkn % | Avge. Points |
Avge. For | Avge. Aga | Avge. Diff. |
G.K. Games | Shut- outs | Shut- out % | Goals In | Goals Avge |
|---|---|---|---|---|---|---|---|---|---|---|---|---|---|---|---|---|
| Camberwell | 10 | 30% | 10% | 60% | 1.000 | 2.500 | 3.000 | -0.500 | ||||||||
| MUHC | 10 | 70% | 10% | 20% | 2.200 | 3.900 | 1.600 | +2.300 | ||||||||
| Kew | 8 | 63% | 13% | 25% | 2.000 | 5.000 | 2.375 | +2.625 | ||||||||
| Altona | 7 | 57% | 43% | 1.714 | 3.429 | 3.714 | -0.286 | |||||||||
| Essendon | 6 | 50% | 50% | 1.500 | 2.333 | 4.667 | -2.333 | |||||||||
| RMIT | 6 | 50% | 50% | 1.500 | 3.667 | 5.333 | -1.667 | |||||||||
| Brunswick | 5 | 60% | 40% | 1.800 | 3.400 | 2.200 | +1.200 | |||||||||
| Doncaster | 4 | 100% | 3.000 | 3.750 | 1.250 | +2.500 | ||||||||||
| Yarra Valley | 4 | 75% | 25% | 2.250 | 4.500 | 2.250 | +2.250 | |||||||||
| Ajax-Maccabi | 4 | 25% | 75% | 0.750 | 3.250 | 5.250 | -2.000 | |||||||||
| Greensborough | 3 | 1 | 0.333 | 100% | 3.000 | 9.000 | 0.333 | +8.667 | ||||||||
| MHSOB | 3 | 67% | 33% | 2.000 | 6.000 | 0.667 | +5.333 | |||||||||
| MCC | 3 | 33% | 67% | 1.000 | 1.667 | 3.000 | -1.333 | 1 | 3 | 3.000 | ||||||
| Grail | 3 | 33% | 33% | 33% | 1.333 | 3.333 | 5.667 | -2.333 | ||||||||
| PEGS | 3 | 67% | 33% | 0.667 | 1.333 | 1.333 | +0.000 | |||||||||
| Casey | 3 | 100% | 3.000 | 3.667 | 0.667 | +3.000 | ||||||||||
| Sandringham | 3 | 33% | 67% | 1.000 | 4.000 | 7.000 | -3.000 | |||||||||
| Kealba | 2 | 100% | 3.000 | 1.500 | 0.500 | +1.000 | ||||||||||
| Mentone | 2 | 100% | 3.000 | 5.500 | 0.500 | +5.000 | ||||||||||
| Werribee | 2 | 100% | 0.000 | 3.500 | 5.000 | -1.500 | ||||||||||
| Footscray | 2 | 100% | 3.000 | 6.500 | 1.000 | +5.500 | ||||||||||
| Reservoir | 2 | 100% | 3.000 | 4.500 | 0.000 | +4.500 | ||||||||||
| Bendigo | 2 | 100% | 0.000 | 2.000 | 9.500 | -7.500 | ||||||||||
| Ballarat | 2 | 100% | 0.000 | 1.500 | 4.000 | -2.500 | ||||||||||
| Corio | 2 | 100% | 0.000 | 1.500 | 4.500 | -3.000 | ||||||||||
| Sth. Knights | 2 | 50% | 50% | 0.500 | 1.500 | 4.000 | -2.500 | |||||||||
| Noonans | 1 | 100% | 0.000 | 0.000 | 6.000 | -6.000 | ||||||||||
| Latrobe Uni | 1 | 100% | 1.000 | 4.000 | 4.000 | +0.000 | ||||||||||
| St.Bedes | 1 | 100% | 3.000 | 3.000 | 2.000 | +1.000 | ||||||||||
| CBCOC | 1 | 100% | 0.000 | 0.000 | 2.000 | -2.000 | ||||||||||
| Frankston | 1 | 100% | 0.000 | 1.000 | 8.000 | -7.000 | ||||||||||
| Opponents :31 | 108 | 1 | 0.009 | 52% | 7% | 41% | 1.630 | 3.500 | 3.083 | +0.417 | 1 | 3 | 3.000 |
Playing Venues
| Venue | Games |
Goals | Avge. |
Win % | Draw % | Loss % | Unkn % | Avge. Points |
Avge. For | Avge. Aga | Avge. Diff. |
G.K. Games | Shut- outs | Shut- out % | Goals In | Goals Avge. |
|---|---|---|---|---|---|---|---|---|---|---|---|---|---|---|---|---|
| Melton Mowbray | 20 | 55% | 5% | 40% | 1.700 | 4.100 | 3.400 | +0.700 | ||||||||
| Altona | 18 | 72% | 6% | 22% | 2.222 | 4.222 | 2.222 | +2.000 | ||||||||
| Essendon | 12 | 58% | 17% | 25% | 1.917 | 4.083 | 1.750 | +2.333 | ||||||||
| SHC | 10 | 30% | 70% | 0.900 | 2.900 | 6.600 | -3.700 | |||||||||
| Footscray | 7 | 29% | 14% | 57% | 1.000 | 3.286 | 3.857 | -0.571 | ||||||||
| PEGS | 6 | 50% | 33% | 17% | 1.833 | 3.333 | 1.833 | +1.500 | ||||||||
| Yarra Velodrome | 3 | 33% | 67% | 1.000 | 4.000 | 2.333 | +1.667 | 1 | 3 | 3.000 | ||||||
| Reservoir | 3 | 67% | 33% | 2.000 | 2.667 | 2.000 | +0.667 | |||||||||
| Camberwell | 3 | 100% | 0.000 | 1.000 | 3.667 | -2.667 | ||||||||||
| Mordialloc | 3 | 67% | 33% | 2.000 | 3.000 | 3.667 | -0.667 | |||||||||
| Albert Park | 3 | 33% | 67% | 1.000 | 3.000 | 5.000 | -2.000 | |||||||||
| Doncaster | 2 | 100% | 3.000 | 2.000 | 1.000 | +1.000 | ||||||||||
| Olympic Park | 2 | 50% | 50% | 1.500 | 3.000 | 1.500 | +1.500 | |||||||||
| Waverley | 2 | 50% | 50% | 1.500 | 2.000 | 1.500 | +0.500 | |||||||||
| Melbourne Uni | 2 | 100% | 3.000 | 4.500 | 1.000 | +3.500 | ||||||||||
| Dandenong | 2 | 50% | 50% | 2.000 | 2.500 | 2.000 | +0.500 | |||||||||
| Melton-G | 1 | 100% | 3.000 | 2.000 | 1.000 | +1.000 | ||||||||||
| Kealba | 1 | 100% | 3.000 | 1.000 | 0.000 | +1.000 | ||||||||||
| Not Recorded | 1 | 100% | 3.000 | 2.000 | 0.000 | +2.000 | ||||||||||
| Monash | 1 | 1 | 1.000 | 100% | 3.000 | 13.000 | 0.000 | +13.000 | ||||||||
| Melbourne High | 1 | 100% | 0.000 | 1.000 | 2.000 | -1.000 | ||||||||||
| Elgar Park | 1 | 100% | 0.000 | 3.000 | 9.000 | -6.000 | ||||||||||
| Bendigo | 1 | 100% | 0.000 | 3.000 | 4.000 | -1.000 | ||||||||||
| Moorabbin | 1 | 100% | 0.000 | 3.000 | 11.000 | -8.000 | ||||||||||
| Ballarat | 1 | 100% | 0.000 | 1.000 | 5.000 | -4.000 | ||||||||||
| Geelong | 1 | 100% | 0.000 | 1.000 | 4.000 | -3.000 | ||||||||||
| Venues :26 | 108 | 1 | 0.009 | 52% | 7% | 41% | 1.630 | 3.500 | 3.083 | +0.417 | 1 | 3 | 3.000 |