 |
Melton Hockey Club |
|
Last updated : 10:40 am - 2 November 2023
Club Cap : 644
(Games : 145, Goals : 6 )
Milestones
| 2006-Apr-22 : | First game (Melton 1 def. Altona (G) 0. R-01: 2006 U11 North) |
| 2007-Jul-28 : | First goal scored (Melton 11 def. Hawthorn 0. R-13: 2007 U11 Pennant North) |
| 2008-Aug-01 : | 50 Junior games (Melton 2 drew Essendon (B) 2. R-14: 2008 U13 North) |
| 2011-Aug-26 : | 100 Junior games (Footscray 2 def. Melton 1. R-17: 2011 U15 West) |
| 2012-Aug-05 : | First Senior game (Greensborough 2 def. Melton 1. R-15: 2012 Metro 3 West Men) |
| 2013-Jun-01 : | Last Senior game (Footscray (R) 2 def. Melton 1. R-08: 2013 Metro 3 West (B)) |
| 2013-Aug-30 : | Last game played (Werribee 3 def. Melton 1. GF: 2013 U16 North/West) |
| Playing career : 2687 days. (7 years and 132 days.) |
Honours, Trophies, and Official Roles
| B&F Runner Up : | 2012-U17 North/West |
| Coach's Award : | 2009-U13 West, 2010-U15 West |
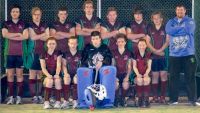
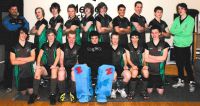
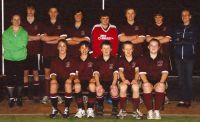
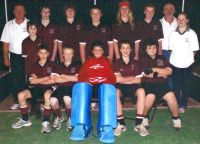
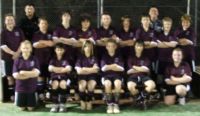
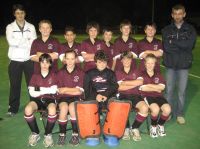
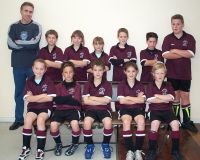
Team Photographs

Complete Playing History
Teams played with : 12
Premierships won : 1
Wooden Spoons : 0
| Games as Player |
Games Won | Games Drawn | Games Lost | Total | Goals | Goalscoring Average |
|---|---|---|---|---|---|---|
| Junior Winter | 66 | 19 | 46 | 131 | 6 | 0.047 |
| Junior Summer | 3 | 2 | 5 | 10 | 0 | 0.000 |
| Junior Total | 69 | 21 | 51 | 141 | 6 | 0.043 |
| Senior Winter | 0 | 1 | 3 | 4 | 0 | 0.000 |
| Total | 69 | 22 | 54 | 145 | 6 | 0.042 |
| Pos. | PR/WS | Div. | Competition | Games | Goals | Avge. | Won | Drawn | Lost | Avge.For | Avge.Aga | Avge.Diff | G.For | G.Aga | GoalDiff |
|---|---|---|---|---|---|---|---|---|---|---|---|---|---|---|---|
| 5 | 2013 Metro 3 West (B)* | 3 | 1 | 2 | 1.000 | 1.667 | -0.667 | 3 | 5 | -002 | |||||
| 2 | 2013 U16 North/West* | 14 | 3 | 0.214 | 7 | 2 | 5 | 2.643 | 1.571 | +1.071 | 37 | 22 | +015 | ||
| 4 | 2012/13 U17 SHC | 10 | 3 | 2 | 5 | 1.300 | 3.300 | -2.000 | 13 | 33 | -020 | ||||
| 9 | 2012 Metro 3 West Men* | 1 | 1 | 1.000 | 2.000 | -1.000 | 1 | 2 | -001 | ||||||
| 3 | 2012 U17 North/West* | 14 | 7 | 1 | 6 | 2.714 | 1.714 | +1.000 | 38 | 24 | +014 | ||||
| 2 | 2011 U17 West* | 2 | 1 | 1 | 1.500 | 4.000 | -2.500 | 3 | 8 | -005 | |||||
| 5 | 2011 U15 West* | 18 | 1 | 0.056 | 9 | 4 | 5 | 3.111 | 1.222 | +1.889 | 56 | 22 | +034 | ||
| 4 | 2010 U15 West* | 18 | 7 | 2 | 9 | 1.667 | 2.278 | -0.611 | 30 | 41 | -011 | ||||
| 6 | 2009 U13 West* | 12 | 1 | 0.083 | 4 | 1 | 7 | 2.000 | 2.833 | -0.833 | 24 | 34 | -010 | ||
| 6 | 2008 U13 North* | 16 | 3 | 7 | 6 | 1.313 | 2.063 | -0.750 | 21 | 33 | -012 | ||||
| 3 | 2007 U11 Pennant North* | 18 | 1 | 0.056 | 13 | 5 | 3.222 | 1.333 | +1.889 | 58 | 24 | +034 | |||
| 1 | PR | 2006 U11 North* | 19 | 15 | 2 | 2 | 2.368 | 0.474 | +1.895 | 45 | 9 | +036 | |||
| 145 | 6 | 0.041 | 69 | 22 | 54 | 2.437 | 1.772 | +0.497 | 329 | 257 | +072 |
Junior Winter Playing History
| Games as Player |
Games Won | Games Drawn | Games Lost | Total | Goals | Goalscoring Average |
|---|---|---|---|---|---|---|
| Junior Winter | 66 | 19 | 46 | 131 | 6 | 0.047 |
| First Game : | Melton 1 def. Altona (G) 0. R-01: 2006 U11 North |
| Last Game : | Werribee 3 def. Melton 1. GF: 2013 U16 North/West |
| Best Win : | Melton 13 def. Werribee 0. R-06: 2011 U15 West |
| Worst Loss : | Geelong 12 def. Melton 0. R-01: 2010 U15 West |
| 1 goal games : | 6 times. Last : Melton 3 def. Footscray 2. R-14: 2013 U16 North/West |
| Finals : | Melton 0 def. Footscray (R) 0. GF: 2006 U11 North Melton 3 def. Box Hill 1. SF: 2006 U11 North Ajax-Maccabi 2 def. Melton 0. SF: 2007 U11 Pennant North Essendon (R) 3 def. Melton 0. SF: 2010 U15 West PEGS 8 def. Melton 0. GF: 2011 U17 West Melton 3 def. Footscray 0. SF: 2011 U17 West Footscray 3 def. Melton 2. SF: 2012 U17 North/West Werribee 3 def. Melton 1. GF: 2013 U16 North/West Melton 4 def. St.Bernards 0. SF: 2013 U16 North/West |
| Premierships : | Melton 0 def. Footscray (R) 0. GF: 2006 U11 North |
Junior Summer Playing History
| Games as Player |
Games Won | Games Drawn | Games Lost | Total | Goals | Goalscoring Average |
|---|---|---|---|---|---|---|
| Junior Summer | 3 | 2 | 5 | 10 | 0 | 0.000 |
| First Game : | Melton 2 def. Essendon (B) 0. R-01: 2012/13 U17 SHC |
| Last Game : | Essendon 2 def. Melton 1. SF: 2012/13 U17 SHC |
| Best Win : | Melton 3 def. Southern United 1. R-08: 2012/13 U17 SHC |
| Worst Loss : | Camberwell 16 def. Melton 0. R-04: 2012/13 U17 SHC |
| Finals : | Essendon 2 def. Melton 1. SF: 2012/13 U17 SHC |
| Premierships : | None. |
Senior Winter Playing History
| Games as Player |
Games Won | Games Drawn | Games Lost | Total | Goals | Goalscoring Average |
|---|---|---|---|---|---|---|
| Senior Winter | 0 | 1 | 3 | 4 | 0 | 0.000 |
| First Game : | Greensborough 2 def. Melton 1. R-15: 2012 Metro 3 West Men |
| Last Game : | Footscray (R) 2 def. Melton 1. R-08: 2013 Metro 3 West (B) |
| Best Win : | Melton 1 drew Essendon 1. R-06: 2013 Metro 3 West (B) |
| Worst Loss : | Footscray (R) 2 def. Melton 1. R-08: 2013 Metro 3 West (B) |
| Finals : | None. |
| Premierships : | None. |
Teammates
Number of teammates :82
| Player |
Games |
Win % | Draw % | Loss % | Unkn % | Avge. Points |
Avge. For | Avge. Aga | Avge. Diff. |
|---|---|---|---|---|---|---|---|---|---|
| McMurrie, Michael* | 131 | 47% | 15% | 38% | 1.565 | 2.267 | 1.794 | +0.473 | |
| Chisholm, Jack* | 98 | 45% | 15% | 40% | 1.500 | 2.347 | 1.898 | +0.449 | |
| Kelly, Lee* | 91 | 38% | 20% | 42% | 1.352 | 2.044 | 2.110 | -0.066 | |
| Strebs-Stelps, Ben* | 72 | 47% | 19% | 33% | 1.611 | 1.944 | 1.806 | +0.139 | |
| Currie, Fraser* | 72 | 43% | 15% | 42% | 1.444 | 2.236 | 2.139 | +0.097 | |
| Kasprzak, Marcus* | 68 | 51% | 16% | 32% | 1.706 | 2.221 | 1.794 | +0.426 | |
| Vallance, Lachlan* | 68 | 40% | 21% | 40% | 1.397 | 2.132 | 1.912 | +0.221 | |
| VellaVanKassel, Nick* | 50 | 48% | 14% | 38% | 1.580 | 2.520 | 1.900 | +0.620 | |
| Lowing, Brayden* | 48 | 46% | 17% | 38% | 1.542 | 2.667 | 1.854 | +0.813 | |
| Pell, Alexander* | 46 | 43% | 17% | 39% | 1.478 | 2.239 | 1.978 | +0.261 | |
| Eastwell, Josh* | 41 | 41% | 10% | 49% | 1.341 | 1.902 | 2.415 | -0.512 | |
| Park, Rylee* | 40 | 48% | 15% | 38% | 1.575 | 2.450 | 1.925 | +0.525 | |
| Griffiths, Rylee* | 38 | 39% | 13% | 47% | 1.316 | 2.053 | 2.000 | +0.053 | |
| Docherty, Benjamin* | 38 | 42% | 8% | 50% | 1.342 | 1.974 | 2.184 | -0.211 | |
| Azzopardi, Holly* | 37 | 76% | 5% | 19% | 2.324 | 2.784 | 0.892 | +1.892 | |
| Corless, Melanie* | 37 | 76% | 5% | 19% | 2.324 | 2.784 | 0.892 | +1.892 | |
| Humphries, Sean* | 37 | 76% | 5% | 19% | 2.324 | 2.784 | 0.892 | +1.892 | |
| Mahon, Isaac* | 37 | 76% | 5% | 19% | 2.324 | 2.784 | 0.892 | +1.892 | |
| Pugh, Chelsea* | 37 | 76% | 5% | 19% | 2.324 | 2.784 | 0.892 | +1.892 | |
| Cicalese, Lauren* | 36 | 75% | 6% | 19% | 2.306 | 2.806 | 0.917 | +1.889 | |
| Lawrence, Casey* | 34 | 44% | 18% | 38% | 1.500 | 2.353 | 1.706 | +0.647 | |
| Lawrence, Jesse* | 32 | 47% | 6% | 47% | 1.469 | 2.000 | 2.031 | -0.031 | |
| Berns, Alannah* | 25 | 40% | 16% | 44% | 1.360 | 2.040 | 2.320 | -0.280 | |
| Shelly-Robbins, James* | 24 | 42% | 13% | 46% | 1.375 | 2.083 | 2.333 | -0.250 | |
| Clotworthy, Joshua* | 23 | 39% | 26% | 35% | 1.435 | 2.043 | 1.609 | +0.435 | |
| Gauci, Natasha* | 20 | 45% | 20% | 35% | 1.550 | 2.600 | 1.800 | +0.800 | |
| Mendez, Samuel* | 19 | 79% | 11% | 11% | 2.474 | 2.368 | 0.474 | +1.895 | |
| Pugh, Ebony* | 19 | 74% | 26% | 2.211 | 3.211 | 1.263 | +1.947 | ||
| Humphrey, Hayden | 19 | 47% | 21% | 32% | 1.632 | 3.000 | 1.263 | +1.737 | |
| Knipe, Lucas* | 19 | 37% | 21% | 42% | 1.316 | 2.158 | 1.737 | +0.421 | |
| Derbass, Caitlyn* | 17 | 47% | 24% | 29% | 1.647 | 2.882 | 1.294 | +1.588 | |
| Powderly, Joshua* | 16 | 75% | 13% | 13% | 2.375 | 2.438 | 0.563 | +1.875 | |
| Morcos, Daniel* | 15 | 13% | 47% | 40% | 0.867 | 1.133 | 2.200 | -1.067 | |
| Muscat, Dylan* | 15 | 20% | 47% | 33% | 1.067 | 1.400 | 2.000 | -0.600 | |
| Martin, Liam* | 15 | 47% | 7% | 47% | 1.467 | 2.400 | 1.800 | +0.600 | |
| Roberts, Jeremy* | 14 | 43% | 14% | 43% | 1.429 | 1.714 | 1.500 | +0.214 | |
| Spano, Luke* | 14 | 50% | 14% | 36% | 1.643 | 2.643 | 1.571 | +1.071 | |
| Rance, Brendan* | 13 | 46% | 15% | 38% | 1.538 | 2.538 | 1.692 | +0.846 | |
| Kelly, Jessica* | 12 | 50% | 17% | 33% | 1.667 | 2.583 | 1.417 | +1.167 | |
| Butcher, Claudia* | 10 | 30% | 10% | 60% | 1.000 | 1.800 | 3.100 | -1.300 | |
| Mitchell, Merry* | 10 | 30% | 10% | 60% | 1.000 | 2.100 | 3.200 | -1.100 | |
| Hobbs, Ebony* | 8 | 38% | 13% | 50% | 1.250 | 2.500 | 2.125 | +0.375 | |
| Anderson, Eliza* | 8 | 50% | 13% | 38% | 1.625 | 2.750 | 3.000 | -0.250 | |
| Jaros, Jessica | 7 | 57% | 43% | 0.571 | 0.714 | 3.143 | -2.429 | ||
| Price, Billie* | 7 | 29% | 14% | 57% | 1.000 | 1.143 | 4.143 | -3.000 | |
| Hoskins, Kathryn* | 6 | 83% | 17% | 2.500 | 2.833 | 0.667 | +2.167 | ||
| Muscat, Madeline* | 6 | 50% | 17% | 33% | 1.667 | 2.833 | 1.333 | +1.500 | |
| Vallance, Liam* | 6 | 17% | 17% | 67% | 0.667 | 2.167 | 2.833 | -0.667 | |
| Hamill, Kalon | 6 | 33% | 67% | 1.000 | 2.333 | 1.667 | +0.667 | ||
| Gray, Joshua | 5 | 20% | 60% | 20% | 1.200 | 2.400 | 1.600 | +0.800 | |
| Fawcett, Tom* | 4 | 75% | 25% | 2.250 | 1.750 | 0.750 | +1.000 | ||
| Strebs-Stelps, Leo* | 4 | 25% | 75% | 0.250 | 1.000 | 1.750 | -0.750 | ||
| Kovarik, Hans* | 3 | 33% | 67% | 0.333 | 1.000 | 1.667 | -0.667 | ||
| Knight, Jason* | 3 | 33% | 67% | 0.333 | 1.000 | 1.667 | -0.667 | ||
| James, Daniel* | 3 | 67% | 33% | 2.000 | 2.667 | 1.667 | +1.000 | ||
| Schwarze, Amy* | 3 | 67% | 33% | 2.000 | 2.667 | 1.667 | +1.000 | ||
| Gati, Andrew* | 2 | 50% | 50% | 1.500 | 1.500 | 4.000 | -2.500 | ||
| Hooley, Aidan* | 2 | 50% | 50% | 1.500 | 1.500 | 4.000 | -2.500 | ||
| Kelly, Bo* | 2 | 50% | 50% | 1.500 | 1.500 | 4.000 | -2.500 | ||
| Knipe, Jessica* | 2 | 50% | 50% | 1.500 | 1.500 | 4.000 | -2.500 | ||
| McMurrie, Tom* | 2 | 50% | 50% | 1.500 | 1.500 | 4.000 | -2.500 | ||
| Salvatore, Aaron* | 2 | 50% | 50% | 1.500 | 1.500 | 4.000 | -2.500 | ||
| Scalzo, Mark* | 2 | 50% | 50% | 1.500 | 1.500 | 4.000 | -2.500 | ||
| Woof, Thomas | 2 | 50% | 50% | 1.500 | 1.500 | 4.000 | -2.500 | ||
| Murphy, Mathew* | 2 | 100% | 0.000 | 1.000 | 2.000 | -1.000 | |||
| Simpson, Matthew* | 2 | 50% | 50% | 0.500 | 1.000 | 1.500 | -0.500 | ||
| Strobel, Joshua* | 2 | 100% | 0.000 | 1.000 | 2.000 | -1.000 | |||
| Jackson, Taylor* | 1 | 100% | 0.000 | 0.000 | 8.000 | -8.000 | |||
| Smith, Shannon* | 1 | 100% | 0.000 | 1.000 | 3.000 | -2.000 | |||
| Gray, Deane | 1 | 100% | 0.000 | 1.000 | 2.000 | -1.000 | |||
| Hooley, Ryan* | 1 | 100% | 0.000 | 1.000 | 2.000 | -1.000 | |||
| Arnold, David* | 1 | 100% | 0.000 | 1.000 | 2.000 | -1.000 | |||
| Crebbin, Jason* | 1 | 100% | 0.000 | 1.000 | 2.000 | -1.000 | |||
| Stanyer, Adrian* | 1 | 100% | 0.000 | 1.000 | 2.000 | -1.000 | |||
| Gorton, David* | 1 | 100% | 1.000 | 1.000 | 1.000 | +0.000 | |||
| Rodrigues, Errol* | 1 | 100% | 1.000 | 1.000 | 1.000 | +0.000 | |||
| Cook, Stuart* | 1 | 100% | 0.000 | 1.000 | 2.000 | -1.000 | |||
| Corban, Malcolm* | 1 | 100% | 0.000 | 1.000 | 2.000 | -1.000 | |||
| Hosking, Robert* | 1 | 100% | 0.000 | 1.000 | 2.000 | -1.000 | |||
| Lawrence, Geoffrey* | 1 | 100% | 0.000 | 1.000 | 2.000 | -1.000 | |||
| Meehan, James* | 1 | 100% | 0.000 | 1.000 | 2.000 | -1.000 | |||
| Shadbolt, Ron* | 1 | 100% | 0.000 | 1.000 | 2.000 | -1.000 |
Opposition Teams
| Opponent |
Games |
Goals | Avge |
Win % | Draw % | Loss % | Unkn % | Avge. Points |
Avge. For | Avge. Aga | Avge. Diff. |
G.K. Games | Shut- outs | Shut- out % | Goals In | Goals Avge |
|---|---|---|---|---|---|---|---|---|---|---|---|---|---|---|---|---|
| Footscray | 28 | 2 | 0.071 | 46% | 4% | 50% | 1.429 | 1.750 | 1.679 | +0.071 | ||||||
| Essendon | 25 | 1 | 0.040 | 40% | 32% | 28% | 1.520 | 1.480 | 1.160 | +0.320 | ||||||
| Altona | 17 | 47% | 18% | 35% | 1.588 | 2.059 | 1.529 | +0.529 | ||||||||
| Werribee | 17 | 53% | 6% | 41% | 1.647 | 3.294 | 2.235 | +1.059 | ||||||||
| Brunswick | 13 | 1 | 0.077 | 77% | 15% | 8% | 2.462 | 4.692 | 0.769 | +3.923 | ||||||
| St.Bernards | 10 | 40% | 10% | 50% | 1.300 | 1.600 | 1.800 | -0.200 | ||||||||
| Box Hill | 7 | 71% | 29% | 2.429 | 2.000 | 0.429 | +1.571 | |||||||||
| Hawthorn | 5 | 1 | 0.200 | 60% | 20% | 20% | 2.000 | 4.200 | 0.800 | +3.400 | ||||||
| Greensborough | 5 | 1 | 0.200 | 60% | 40% | 1.800 | 2.400 | 1.000 | +1.400 | |||||||
| Yarra Valley | 4 | 50% | 50% | 2.000 | 3.250 | 1.000 | +2.250 | |||||||||
| Ajax-Maccabi | 3 | 100% | 0.000 | 1.000 | 2.667 | -1.667 | ||||||||||
| Doncaster | 2 | 50% | 50% | 1.500 | 2.000 | 2.000 | +0.000 | |||||||||
| Geelong | 2 | 100% | 0.000 | 0.000 | 10.500 | -10.500 | ||||||||||
| Southern United | 2 | 50% | 50% | 1.500 | 2.500 | 2.500 | +0.000 | |||||||||
| Kew | 1 | 100% | 0.000 | 0.000 | 5.000 | -5.000 | ||||||||||
| Powerhouse | 1 | 100% | 0.000 | 0.000 | 3.000 | -3.000 | ||||||||||
| MUHC | 1 | 100% | 1.000 | 3.000 | 3.000 | +0.000 | ||||||||||
| PEGS | 1 | 100% | 0.000 | 0.000 | 8.000 | -8.000 | ||||||||||
| Camberwell | 1 | 100% | 0.000 | 0.000 | 16.000 | -16.000 | ||||||||||
| Opponents :19 | 145 | 6 | 0.041 | 48% | 15% | 37% | 1.579 | 2.269 | 1.772 | +0.497 |
Playing Venues
| Venue | Games |
Goals | Avge. |
Win % | Draw % | Loss % | Unkn % | Avge. Points |
Avge. For | Avge. Aga | Avge. Diff. |
G.K. Games | Shut- outs | Shut- out % | Goals In | Goals Avge. |
|---|---|---|---|---|---|---|---|---|---|---|---|---|---|---|---|---|
| Melton Mowbray | 64 | 4 | 0.063 | 52% | 14% | 34% | 1.688 | 2.375 | 1.719 | +0.656 | ||||||
| Footscray | 15 | 33% | 7% | 60% | 1.067 | 1.400 | 2.400 | -1.000 | ||||||||
| Essendon | 15 | 40% | 20% | 40% | 1.400 | 1.800 | 1.400 | +0.400 | ||||||||
| Altona | 11 | 27% | 27% | 45% | 1.091 | 1.182 | 1.818 | -0.636 | ||||||||
| Werribee | 10 | 70% | 30% | 2.100 | 4.000 | 1.600 | +2.400 | |||||||||
| SHC | 10 | 30% | 30% | 40% | 1.200 | 1.300 | 2.800 | -1.500 | ||||||||
| Brunswick | 4 | 100% | 3.000 | 4.500 | 0.000 | +4.500 | ||||||||||
| St.Bernards | 4 | 25% | 25% | 50% | 1.000 | 1.500 | 2.750 | -1.250 | ||||||||
| Yarra Valley | 3 | 67% | 33% | 2.333 | 3.000 | 0.667 | +2.333 | |||||||||
| Greensborough | 3 | 1 | 0.333 | 67% | 33% | 2.000 | 3.000 | 1.000 | +2.000 | |||||||
| Doncaster | 2 | 100% | 3.000 | 3.500 | 1.500 | +2.000 | ||||||||||
| Albert Park | 2 | 100% | 0.000 | 1.000 | 3.000 | -2.000 | ||||||||||
| Hawthorn | 2 | 1 | 0.500 | 50% | 50% | 2.000 | 6.000 | 0.500 | +5.500 | |||||||
| Venues :13 | 145 | 6 | 0.041 | 48% | 15% | 37% | 1.579 | 2.269 | 1.772 | +0.497 |