 |
Melton Hockey Club |
|
Last updated : 11:11 am - 2 November 2023
Club Cap : 500
(Games : 121, Goals : 24 )
First XI Men's Cap : 122
(Games : 5, Goals : 0)
Milestones
| 2001-Mar-30 : | First Junior game (Brunswick 3 def. Melton 0. R-01: 2001 U13 North) |
| 2001-Mar-30 : | First game (Brunswick 3 def. Melton 0. R-01: 2001 U13 North) |
| 2001-May-11 : | First goal scored (Melton 1 drew Altona 1. R-06: 2001 U13 North) |
| 2004-May-07 : | 50 Junior games (Melton 6 def. Waverley 0. R-04: 2004 U15 North) |
| 2005-Aug-26 : | Last Junior game (Kew 3 def. Melton 0. R-18: 2005 U17 North) |
| 2008-Apr-20 : | First First XI Mens game (Melton 5 def. Collegians-X 1. R-01: 2008 State League 4 Men) |
| 2008-Jul-12 : | Last First XI Mens game played (Casey 17 def. Melton 0. R-11: 2008 State League 4 Men) |
| 2008-Jul-19 : | First Senior goal (Melton 6 def. Latrobe Uni 1. R-12: 2008 Metro 2 West Men) |
| 2009-Sep-19 : | Last Senior game (Footscray 4 def. Melton 2. GF: 2009 Metro 2 West Men) |
| 2009-Sep-19 : | Last game played (Footscray 4 def. Melton 2. GF: 2009 Metro 2 West Men) |
| Playing career : 3095 days. (8 years and 175 days.) |
Honours, Trophies, and Official Roles
| Best and Fairest : | 2001-U13 North, 2005-U17 North |
| B&F Runner Up : | 2004-U15 North |
| Coach's Award : | 2009-Metro 2 West Men |
| Captain : | 2005-U17 North |
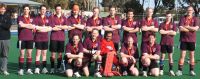
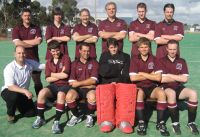
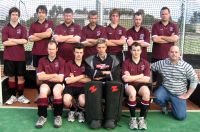
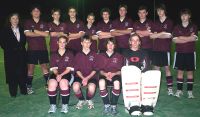
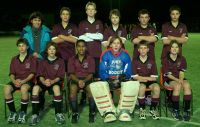
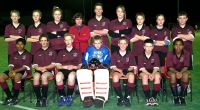
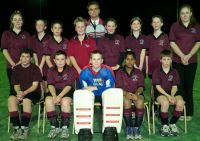
Team Photographs
Complete Playing History
Teams played with : 9
Premierships won : 0
Wooden Spoons : 2
| Games as Player |
Games Won | Games Drawn | Games Lost | Total | Goals | Goalscoring Average |
|---|---|---|---|---|---|---|
| Junior Winter | 25 | 13 | 45 | 83 | 20 | 0.241 |
| Senior Winter | 23 | 5 | 10 | 38 | 4 | 0.105 |
| Total | 48 | 18 | 55 | 121 | 24 | 0.198 |
| Pos. | PR/WS | Div. | Competition | Games | Goals | Avge. | Won | Drawn | Lost | Avge.For | Avge.Aga | Avge.Diff | G.For | G.Aga | GoalDiff |
|---|---|---|---|---|---|---|---|---|---|---|---|---|---|---|---|
| 2 | 2009 Metro 2 West Men* | 20 | 1 | 0.050 | 14 | 3 | 3 | 4.700 | 1.600 | +3.100 | 94 | 32 | +062 | ||
| 5 | 2008 State League 4 Men* | 5 | 2 | 3 | 2.600 | 5.200 | -2.600 | 13 | 26 | -013 | |||||
| 6 | 2008 Metro 2 West Men* | 13 | 3 | 0.231 | 7 | 2 | 4 | 2.385 | 1.692 | +0.692 | 31 | 22 | +009 | ||
| 8 | 2005 U17 Pennant North* | 1 | 1 | 0.000 | 3.000 | -3.000 | 0 | 3 | -003 | ||||||
| 8 | WS | 2005 U17 North* | 17 | 6 | 0.353 | 3 | 2 | 12 | 0.941 | 3.235 | -2.294 | 16 | 55 | -039 | |
| 3 | 2004 U15 North* | 19 | 7 | 0.368 | 11 | 4 | 4 | 2.474 | 1.000 | +1.474 | 47 | 19 | +028 | ||
| 5 | 2003 U15 North* | 14 | 3 | 0.214 | 7 | 1 | 6 | 2.571 | 2.500 | +0.071 | 36 | 35 | +001 | ||
| 9 | WS | 2002 U13 Pennant North* | 16 | 1 | 0.063 | 3 | 13 | 0.625 | 3.250 | -2.625 | 10 | 52 | -042 | ||
| 8 | 2001 U13 North* | 16 | 3 | 0.188 | 4 | 3 | 9 | 1.000 | 2.188 | -1.188 | 16 | 35 | -019 | ||
| 121 | 24 | 0.198 | 48 | 18 | 55 | 2.604 | 2.306 | -0.132 | 263 | 279 | -016 |
Junior Winter Playing History
| Games as Player |
Games Won | Games Drawn | Games Lost | Total | Goals | Goalscoring Average |
|---|---|---|---|---|---|---|
| Junior Winter | 25 | 13 | 45 | 83 | 20 | 0.241 |
| First Game : | Brunswick 3 def. Melton 0. R-01: 2001 U13 North |
| Last Game : | Kew 3 def. Melton 0. R-18: 2005 U17 North |
| Best Win : | Melton 7 def. Werribee 0. R-08: 2003 U15 North |
| Worst Loss : | Camberwell 12 def. Melton 1. R-03: 2005 U17 North |
| 1 goal games : | 16 times. Last : Melton 2 drew Werribee 2. R-12: 2005 U17 North |
| 2 goal games : | 2 times. Last : Essendon 4 def. Melton 2. R-15: 2005 U17 North |
| Finals : | TEM (L) 2 def. Melton 0. SF: 2004 U15 North |
| Premierships : | None. |
Senior Winter Playing History
| Games as Player |
Games Won | Games Drawn | Games Lost | Total | Goals | Goalscoring Average |
|---|---|---|---|---|---|---|
| Senior Winter | 23 | 5 | 10 | 38 | 4 | 0.105 |
| First Game : | Melton 5 def. Collegians-X 1. R-01: 2008 State League 4 Men |
| Last Game : | Footscray 4 def. Melton 2. GF: 2009 Metro 2 West Men |
| Best Win : | Melton 14 def. Latrobe Uni 0. R-08: 2009 Metro 2 West Men |
| Worst Loss : | Casey 17 def. Melton 0. R-11: 2008 State League 4 Men |
| 1 goal games : | 4 times. Last : Melton 5 def. Brunswick 2. R-02: 2009 Metro 2 West Men |
| Finals : | Footscray 4 def. Melton 2. GF: 2009 Metro 2 West Men Melton 4 def. PEGS 0. PF: 2009 Metro 2 West Men Footscray 4 def. Melton 2. SF: 2009 Metro 2 West Men |
| Premierships : | None. |
Teammates
Number of teammates :77
| Player |
Games |
Win % | Draw % | Loss % | Unkn % | Avge. Points |
Avge. For | Avge. Aga | Avge. Diff. |
|---|---|---|---|---|---|---|---|---|---|
| Spence, Adam* | 76 | 33% | 16% | 51% | 1.145 | 1.618 | 2.342 | -0.724 | |
| Mumford, Matthew* | 75 | 40% | 17% | 43% | 1.373 | 1.987 | 2.000 | -0.013 | |
| Buttigieg, William* | 75 | 32% | 16% | 52% | 1.120 | 1.560 | 2.427 | -0.867 | |
| Holahan, Zac* | 71 | 38% | 15% | 46% | 1.296 | 2.268 | 2.296 | -0.028 | |
| Downs, Andrew* | 61 | 28% | 16% | 56% | 1.000 | 1.541 | 2.574 | -1.033 | |
| Clough, Jarryd* | 51 | 47% | 18% | 35% | 1.588 | 2.784 | 1.882 | +0.902 | |
| Bosquet, Dane* | 47 | 38% | 17% | 45% | 1.319 | 1.979 | 2.043 | -0.064 | |
| Doran, Dale* | 39 | 26% | 18% | 56% | 0.949 | 1.462 | 2.385 | -0.923 | |
| Noonan, Kristian* | 39 | 56% | 13% | 31% | 1.821 | 2.718 | 1.718 | +1.000 | |
| Doran, Kimberly* | 37 | 27% | 19% | 54% | 1.000 | 1.541 | 2.324 | -0.784 | |
| Sproal, Beth* | 36 | 25% | 14% | 61% | 0.889 | 1.472 | 2.528 | -1.056 | |
| Hooley, Ryan* | 36 | 39% | 17% | 44% | 1.333 | 1.750 | 2.056 | -0.306 | |
| Hosking, Michael* | 34 | 62% | 12% | 26% | 1.971 | 2.912 | 1.765 | +1.147 | |
| Downs, Cassandra* | 33 | 36% | 18% | 45% | 1.273 | 1.758 | 1.848 | -0.091 | |
| Spence, Jessica* | 31 | 35% | 13% | 52% | 1.194 | 1.710 | 2.710 | -1.000 | |
| Baker, Daniel* | 30 | 37% | 13% | 50% | 1.233 | 1.700 | 2.233 | -0.533 | |
| Agius, Jesse* | 28 | 39% | 18% | 43% | 1.357 | 1.893 | 1.893 | +0.000 | |
| Slocombe, Morgan* | 28 | 64% | 14% | 21% | 2.071 | 3.964 | 1.714 | +2.250 | |
| Greed, Justin* | 27 | 63% | 11% | 26% | 2.000 | 3.778 | 1.704 | +2.074 | |
| Strobel, Joshua* | 25 | 64% | 16% | 20% | 2.080 | 4.160 | 1.760 | +2.400 | |
| Rodrigues, Errol* | 24 | 67% | 13% | 21% | 2.125 | 3.417 | 1.750 | +1.667 | |
| Sorensen, Steven* | 20 | 55% | 15% | 30% | 1.800 | 3.800 | 2.600 | +1.200 | |
| Lawrence, Daryl* | 20 | 70% | 15% | 15% | 2.250 | 4.700 | 1.600 | +3.100 | |
| Haycock, John* | 19 | 16% | 16% | 68% | 0.632 | 0.895 | 3.053 | -2.158 | |
| Bluschke, Alf* | 19 | 63% | 11% | 26% | 2.000 | 3.368 | 1.789 | +1.579 | |
| Downs, David* | 19 | 74% | 16% | 11% | 2.368 | 4.842 | 1.474 | +3.368 | |
| Gati, Nick* | 18 | 67% | 17% | 17% | 2.167 | 4.333 | 1.667 | +2.667 | |
| Graetz, Brian* | 17 | 24% | 29% | 47% | 1.000 | 1.059 | 2.059 | -1.000 | |
| Matthews, Ben* | 17 | 53% | 6% | 41% | 1.647 | 2.588 | 2.353 | +0.235 | |
| Self, Ryan* | 16 | 44% | 6% | 50% | 1.375 | 2.438 | 3.188 | -0.750 | |
| May, Jarrod* | 15 | 27% | 20% | 53% | 1.000 | 1.067 | 2.267 | -1.200 | |
| Wilmshurst, Shaun* | 15 | 27% | 20% | 53% | 1.000 | 1.067 | 2.267 | -1.200 | |
| Arnold, Chris* | 15 | 60% | 7% | 33% | 1.867 | 4.600 | 2.800 | +1.800 | |
| Kovarik, Brenda* | 14 | 14% | 86% | 0.143 | 0.500 | 3.286 | -2.786 | ||
| Bonney, Michael* | 14 | 50% | 7% | 43% | 1.571 | 2.571 | 2.214 | +0.357 | |
| Johnson, Shaun* | 14 | 7% | 14% | 79% | 0.357 | 0.786 | 3.000 | -2.214 | |
| Hocking, Branton* | 13 | 23% | 15% | 62% | 0.846 | 1.000 | 3.154 | -2.154 | |
| Lightley, Pamela* | 13 | 15% | 8% | 77% | 0.538 | 0.769 | 2.923 | -2.154 | |
| Darcy, Astin* | 13 | 54% | 15% | 31% | 1.769 | 2.385 | 1.692 | +0.692 | |
| Kovarik, Hans* | 12 | 50% | 17% | 33% | 1.667 | 2.333 | 1.750 | +0.583 | |
| Edwards, Jeremy* | 10 | 20% | 10% | 70% | 0.700 | 0.800 | 2.500 | -1.700 | |
| Fitzgerald, Tim* | 10 | 10% | 20% | 70% | 0.500 | 0.800 | 2.700 | -1.900 | |
| Corban, Malcolm* | 9 | 44% | 22% | 33% | 1.556 | 2.556 | 2.111 | +0.444 | |
| Shadbolt, Ron* | 8 | 50% | 25% | 25% | 1.750 | 3.000 | 2.125 | +0.875 | |
| Hogg, Matthew* | 7 | 14% | 86% | 0.143 | 0.286 | 2.857 | -2.571 | ||
| Baker, Gavin* | 7 | 71% | 29% | 2.143 | 2.857 | 2.143 | +0.714 | ||
| Halligan, Alan* | 6 | 17% | 83% | 0.167 | 0.333 | 3.000 | -2.667 | ||
| Hanley-Wood, Ben* | 6 | 50% | 50% | 1.500 | 2.500 | 4.500 | -2.000 | ||
| Stanyer, Adrian* | 6 | 50% | 50% | 1.500 | 2.833 | 4.500 | -1.667 | ||
| Purdie, Samantha* | 5 | 40% | 60% | 1.200 | 1.000 | 3.200 | -2.200 | ||
| Arnold, Andrew* | 5 | 40% | 60% | 1.200 | 3.000 | 2.600 | +0.400 | ||
| Lawrence, Stephen* | 5 | 40% | 60% | 1.200 | 2.600 | 5.200 | -2.600 | ||
| Bell, Ray* | 5 | 40% | 60% | 0.400 | 0.800 | 1.800 | -1.000 | ||
| Dixon, Daniel* | 4 | 25% | 25% | 50% | 1.000 | 1.250 | 2.000 | -0.750 | |
| Brazil, Sean* | 4 | 50% | 50% | 1.500 | 3.250 | 2.250 | +1.000 | ||
| Kelly, Bo* | 4 | 100% | 3.000 | 4.750 | 1.500 | +3.250 | |||
| Bennett, Graeme* | 4 | 100% | 3.000 | 4.250 | 1.750 | +2.500 | |||
| Thomas, Liam* | 3 | 33% | 67% | 1.000 | 1.000 | 1.333 | -0.333 | ||
| Lawrence, Glenn* | 3 | 67% | 33% | 2.000 | 3.000 | 6.333 | -3.333 | ||
| McLaren, Scott* | 3 | 67% | 33% | 2.000 | 3.667 | 1.667 | +2.000 | ||
| Holahan, Lucy* | 2 | 100% | 0.000 | 0.000 | 3.000 | -3.000 | |||
| Mumford, Nicole* | 2 | 100% | 0.000 | 0.000 | 6.000 | -6.000 | |||
| Dine, Brenton* | 2 | 100% | 0.000 | 0.500 | 7.500 | -7.000 | |||
| Hobbs, Neil* | 2 | 100% | 0.000 | 0.000 | 1.500 | -1.500 | |||
| Anderson, Matthew* | 2 | 50% | 50% | 2.000 | 5.500 | 1.000 | +4.500 | ||
| Cook, Stuart* | 2 | 50% | 50% | 1.500 | 8.000 | 2.000 | +6.000 | ||
| Graetz, Ashley* | 1 | 100% | 0.000 | 0.000 | 1.000 | -1.000 | |||
| Kovarik, John* | 1 | 100% | 0.000 | 0.000 | 3.000 | -3.000 | |||
| McCann, Matthew* | 1 | 100% | 0.000 | 1.000 | 4.000 | -3.000 | |||
| Darcy, Thurston* | 1 | 100% | 0.000 | 0.000 | 3.000 | -3.000 | |||
| Kovas, Tim | 1 | 100% | 0.000 | 0.000 | 3.000 | -3.000 | |||
| O`Shae, Ryan* | 1 | 100% | 3.000 | 4.000 | 1.000 | +3.000 | |||
| Lawrence, Tony* | 1 | 100% | 0.000 | 0.000 | 17.000 | -17.000 | |||
| Williams, Mark* | 1 | 100% | 1.000 | 1.000 | 1.000 | +0.000 | |||
| Hoad, Simon* | 1 | 100% | 3.000 | 6.000 | 1.000 | +5.000 | |||
| Lawrence, William* | 1 | 100% | 3.000 | 8.000 | 1.000 | +7.000 | |||
| Vallance, Liam* | 1 | 100% | 3.000 | 8.000 | 1.000 | +7.000 |
Opposition Teams
| Opponent |
Games |
Goals | Avge |
Win % | Draw % | Loss % | Unkn % | Avge. Points |
Avge. For | Avge. Aga | Avge. Diff. |
G.K. Games | Shut- outs | Shut- out % | Goals In | Goals Avge |
|---|---|---|---|---|---|---|---|---|---|---|---|---|---|---|---|---|
| Altona | 14 | 2 | 0.143 | 29% | 29% | 43% | 1.143 | 1.571 | 2.214 | -0.643 | ||||||
| Yarra Valley | 11 | 2 | 0.182 | 45% | 27% | 27% | 1.636 | 2.364 | 1.727 | +0.636 | ||||||
| Essendon | 11 | 3 | 0.273 | 64% | 9% | 27% | 2.000 | 2.182 | 1.636 | +0.545 | ||||||
| Werribee | 11 | 2 | 0.182 | 45% | 18% | 36% | 1.545 | 1.909 | 2.182 | -0.273 | ||||||
| Footscray | 10 | 2 | 0.200 | 30% | 30% | 40% | 1.200 | 2.400 | 2.100 | +0.300 | ||||||
| Greensborough | 9 | 1 | 0.111 | 22% | 22% | 56% | 0.889 | 1.333 | 2.111 | -0.778 | ||||||
| TEM | 7 | 2 | 0.286 | 29% | 14% | 57% | 1.000 | 1.714 | 1.857 | -0.143 | ||||||
| Brunswick | 5 | 1 | 0.200 | 40% | 20% | 40% | 1.400 | 3.000 | 2.200 | +0.800 | ||||||
| Hawthorn | 5 | 100% | 0.000 | 0.600 | 3.600 | -3.000 | ||||||||||
| Camberwell | 5 | 2 | 0.400 | 20% | 80% | 0.600 | 1.200 | 5.400 | -4.200 | |||||||
| Waverley | 5 | 2 | 0.400 | 60% | 40% | 1.800 | 3.200 | 1.800 | +1.400 | |||||||
| Latrobe Uni | 5 | 1 | 0.200 | 100% | 3.000 | 5.600 | 0.400 | +5.200 | ||||||||
| St.Bernards | 4 | 4 | 1.000 | 25% | 25% | 50% | 1.000 | 2.250 | 3.500 | -1.250 | ||||||
| MUHC | 4 | 50% | 50% | 1.500 | 4.250 | 1.500 | +2.750 | |||||||||
| PEGS | 3 | 67% | 33% | 2.000 | 3.667 | 2.000 | +1.667 | |||||||||
| MCC | 2 | 100% | 0.000 | 0.500 | 2.500 | -2.000 | ||||||||||
| Powerhouse | 2 | 100% | 3.000 | 1.500 | 0.000 | +1.500 | ||||||||||
| Kew | 2 | 100% | 0.000 | 0.500 | 3.000 | -2.500 | ||||||||||
| Doncaster | 1 | 100% | 3.000 | 3.000 | 2.000 | +1.000 | ||||||||||
| Ballarat | 1 | 100% | 0.000 | 0.000 | 3.000 | -3.000 | ||||||||||
| Collegians-X | 1 | 100% | 3.000 | 5.000 | 1.000 | +4.000 | ||||||||||
| Bendigo | 1 | 100% | 0.000 | 2.000 | 4.000 | -2.000 | ||||||||||
| Ajax-Maccabi | 1 | 100% | 0.000 | 2.000 | 3.000 | -1.000 | ||||||||||
| Casey | 1 | 100% | 0.000 | 0.000 | 17.000 | -17.000 | ||||||||||
| Opponents :24 | 121 | 24 | 0.198 | 40% | 15% | 45% | 1.339 | 2.174 | 2.306 | -0.132 |
Playing Venues
| Venue | Games |
Goals | Avge. |
Win % | Draw % | Loss % | Unkn % | Avge. Points |
Avge. For | Avge. Aga | Avge. Diff. |
G.K. Games | Shut- outs | Shut- out % | Goals In | Goals Avge. |
|---|---|---|---|---|---|---|---|---|---|---|---|---|---|---|---|---|
| Melton Mowbray | 58 | 17 | 0.293 | 47% | 14% | 40% | 1.534 | 2.879 | 2.034 | +0.845 | ||||||
| Altona | 9 | 1 | 0.111 | 22% | 22% | 56% | 0.889 | 1.222 | 3.000 | -1.778 | ||||||
| Werribee | 6 | 50% | 50% | 1.500 | 1.167 | 2.333 | -1.167 | |||||||||
| Essendon | 5 | 1 | 0.200 | 60% | 20% | 20% | 2.000 | 1.800 | 1.800 | +0.000 | ||||||
| Footscray | 5 | 1 | 0.200 | 20% | 20% | 60% | 0.800 | 1.800 | 2.800 | -1.000 | ||||||
| Melbourne High | 5 | 100% | 0.000 | 0.400 | 3.400 | -3.000 | ||||||||||
| Reservoir | 5 | 80% | 20% | 2.600 | 2.200 | 0.600 | +1.600 | |||||||||
| SHC | 4 | 1 | 0.250 | 50% | 50% | 1.500 | 2.500 | 2.000 | +0.500 | |||||||
| Hawthorn | 3 | 33% | 67% | 0.333 | 0.667 | 1.667 | -1.000 | |||||||||
| Greensborough | 3 | 100% | 0.000 | 0.000 | 2.667 | -2.667 | ||||||||||
| Yarra Valley | 3 | 33% | 67% | 0.333 | 0.333 | 3.333 | -3.000 | |||||||||
| Yarra Velodrome | 2 | 50% | 50% | 0.500 | 0.500 | 2.000 | -1.500 | |||||||||
| St.Bernards | 2 | 2 | 1.000 | 50% | 50% | 0.500 | 1.500 | 3.000 | -1.500 | |||||||
| Monash | 2 | 50% | 50% | 1.500 | 3.000 | 1.500 | +1.500 | |||||||||
| Brunswick | 2 | 1 | 0.500 | 50% | 50% | 2.000 | 3.500 | 2.000 | +1.500 | |||||||
| Doncaster | 1 | 100% | 3.000 | 3.000 | 2.000 | +1.000 | ||||||||||
| Albert Park | 1 | 100% | 3.000 | 2.000 | 0.000 | +2.000 | ||||||||||
| Elgar Park | 1 | 100% | 0.000 | 0.000 | 3.000 | -3.000 | ||||||||||
| Moorabbin | 1 | 100% | 3.000 | 5.000 | 1.000 | +4.000 | ||||||||||
| Bendigo | 1 | 100% | 0.000 | 2.000 | 4.000 | -2.000 | ||||||||||
| Berwick | 1 | 100% | 0.000 | 0.000 | 17.000 | -17.000 | ||||||||||
| PEGS | 1 | 100% | 3.000 | 5.000 | 2.000 | +3.000 | ||||||||||
| Venues :22 | 121 | 24 | 0.198 | 40% | 15% | 45% | 1.339 | 2.174 | 2.306 | -0.132 |