 |
Melton Hockey Club |
|
Last updated : 11:16 am - 2 November 2023
Club Cap : 640
(Games : 196, Goals : 20 )
First XI Men's Cap : 131
(Games : 63, Goals : 2)
Games Umpired : 2
(Senior : 0, Veteran : 0, Junior : 2)
Milestones
| 2006-Apr-21 : | First Junior game (Hawthorn 2 def. Melton 1. R-01: 2006 U13 Pennant North) |
| 2006-Apr-21 : | First game (Hawthorn 2 def. Melton 1. R-01: 2006 U13 Pennant North) |
| 2007-Jun-01 : | First goal scored (Melton 8 def. MUHC 0. R-07: 2007 U15 North) |
| 2008-Aug-02 : | First Senior game (Powerhouse 8 def. Melton 1. R-14: 2008 Metro 3 West Men) |
| 2008-Dec-11 : | 50 Junior games (Southern United 6 def. Melton 1. R-07: 2008/09 SHC-2 Under 15) |
| 2009-Apr-18 : | First Senior goal (Melton 8 def. RMIT 5. R-01: 2009 Metro 3 West Men) |
| 2009-Aug-09 : | First First XI Mens game (PEGS 3 def. Melton 1. R-15: 2009 State League 4 Men) |
| 2010-Sep-17 : | Last Junior game (Melton 5 def. Brunswick 0. GF: 2010 U17 West) |
| 2011-Jul-29 : | First game umpired (Melton 7 def. Werribee 0. R-13: 2011 U15 West) |
| 2012-Apr-27 : | Last game umpired (Melton 2 drew Greensborough 2. R-03: 2012 U15 North/West) |
| 2021-Jul-31 : | Last First XI Mens game played (WestVic 6 def. Melton 3. R-10: 2021 Vic League 3 Men) |
| 2021-Jul-31 : | Last game played (WestVic 6 def. Melton 3. R-10: 2021 Vic League 3 Men) |
| Playing career : 5580 days. (15 years and 105 days.) |
Honours, Trophies, and Official Roles
| Outstanding Junior : | 2007/08 |
| Best and Fairest : | 2007-U15 North |
| B&F Runner Up : | 2009-Metro 3 West Men |
| Coach's Award : | 2010-U17 West, 2012-State League 4 Men |
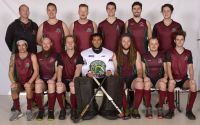
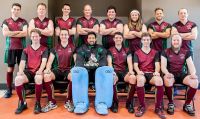
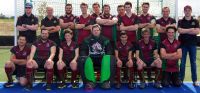
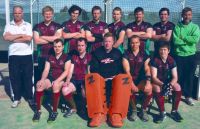
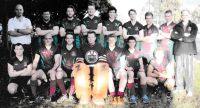
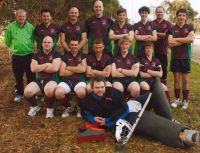
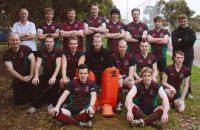
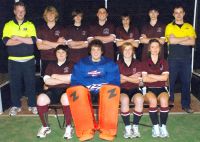
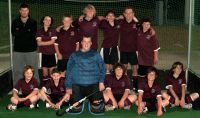
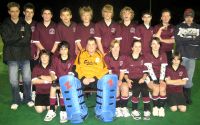
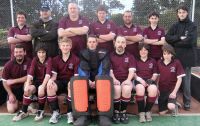
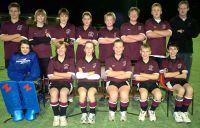
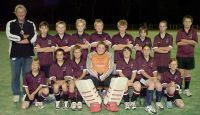
Team Photographs
Complete Playing History
Teams played with : 23
Premierships won : 1
Wooden Spoons : 1
| Games as Player |
Games Won | Games Drawn | Games Lost | Total | Goals | Goalscoring Average |
|---|---|---|---|---|---|---|
| Junior Winter | 13 | 2 | 40 | 55 | 4 | 0.075 |
| Junior Summer | 2 | 1 | 2 | 5 | 0 | 0.000 |
| Junior Total | 15 | 3 | 42 | 60 | 4 | 0.069 |
| Senior Winter | 46 | 18 | 62 | 126 | 14 | 0.111 |
| Senior Summer | 1 | 0 | 9 | 10 | 2 | 0.200 |
| Senior Total | 47 | 18 | 71 | 136 | 16 | 0.118 |
| Total | 62 | 21 | 113 | 196 | 20 | 0.103 |
| Pos. | PR/WS | Div. | Competition | Games | Goals | Avge. | Won | Drawn | Lost | Avge.For | Avge.Aga | Avge.Diff | G.For | G.Aga | GoalDiff |
|---|---|---|---|---|---|---|---|---|---|---|---|---|---|---|---|
| 4 | 2021 Vic League 3 Men | 4 | 2 | 1 | 1 | 3.750 | 2.000 | +1.750 | 15 | 8 | +007 | ||||
| 1 | 2021 Pennant G Men* | 3 | 1 | 0.333 | 3 | 7.333 | 1.333 | +6.000 | 22 | 4 | +018 | ||||
| 6 | 2021 Metro B North/West Men* | 2 | 1 | 0.500 | 1 | 1 | 2.500 | 2.000 | +0.500 | 5 | 4 | +001 | |||
| 5 | 2019 Vic League 3 Men* | 11 | 5 | 1 | 5 | 2.727 | 2.455 | +0.273 | 30 | 27 | +003 | ||||
| 4 | 2019 Pennant G Men* | 4 | 2 | 2 | 2.000 | 2.000 | +0.000 | 8 | 8 | +000 | |||||
| 5 | 2018 Vic League 3 Men* | 10 | 4 | 6 | 2.500 | 2.600 | -0.100 | 25 | 26 | -001 | |||||
| 6 | 2018 Pennant G Men* | 8 | 1 | 1 | 6 | 2.125 | 4.375 | -2.250 | 17 | 35 | -018 | ||||
| 5 | 2017 Vic League 3 Men* | 1 | 1 | 0.000 | 5.000 | -5.000 | 0 | 5 | -005 | ||||||
| 4 | 2017 Vic League 3 Res. Men* | 10 | 3 | 1 | 6 | 2.200 | 2.800 | -0.600 | 22 | 28 | -006 | ||||
| 6 | 2013 Vic League 3 Men* | 16 | 2 | 0.125 | 5 | 4 | 7 | 2.063 | 2.500 | -0.438 | 33 | 40 | -007 | ||
| 7 | 2013 Vic League 3 Res. Men* | 7 | 2 | 0.286 | 4 | 3 | 3.143 | 2.429 | +0.714 | 22 | 17 | +005 | |||
| ? | WS | 2012/13 Footscray Summer | 10 | 2 | 0.200 | 1 | 9 | 1.900 | 6.300 | -4.400 | 19 | 63 | -044 | ||
| 8 | 2012 State League 4 Men* | 15 | 3 | 3 | 9 | 1.467 | 2.867 | -1.400 | 22 | 43 | -021 | ||||
| 3 | 2011 State League 5 Men* | 2 | 1 | 1 | 2.500 | 1.500 | +1.000 | 5 | 3 | +002 | |||||
| 3 | 2011 Metro 2 West Men* | 15 | 3 | 0.200 | 9 | 3 | 3 | 3.933 | 1.800 | +2.133 | 59 | 27 | +032 | ||
| 1 | PR | 2010 U17 West* | 10 | 3 | 0.300 | 7 | 3 | 3.100 | 1.900 | +1.200 | 31 | 19 | +012 | ||
| 8 | 2009 State League 4 Men* | 4 | 1 | 3 | 1.250 | 3.000 | -1.750 | 5 | 12 | -007 | |||||
| 7 | 2009 Metro 3 West Men* | 12 | 5 | 0.417 | 3 | 2 | 7 | 1.917 | 2.333 | -0.417 | 23 | 28 | -005 | ||
| 6 | 2008/09 SHC-2 Under 15* | 5 | 2 | 1 | 2 | 1.200 | 2.000 | -0.800 | 6 | 10 | -004 | ||||
| 9 | 2008 Metro 3 West Men* | 2 | 2 | 0.500 | 5.000 | -4.500 | 1 | 10 | -009 | ||||||
| 9 | 2008 U15 Pennant North* | 16 | 1 | 2 | 13 | 0.563 | 4.313 | -3.750 | 9 | 69 | -060 | ||||
| 8 | 2007 U15 North* | 15 | 1 | 0.067 | 2 | 13 | 1.200 | 3.733 | -2.533 | 18 | 56 | -038 | |||
| 8 | 2006 U13 Pennant North* | 14 | 3 | 11 | 1.429 | 2.786 | -1.357 | 20 | 39 | -019 | |||||
| 196 | 20 | 0.102 | 62 | 21 | 113 | 2.149 | 2.964 | -0.837 | 417 | 581 | -164 |
Umpiring History
Year    Division                      SEN VET JUN
2011    U15 West                                1
2012    U15 North/West                          1

SUBTOTAL                                        2
TOTAL                                           2
Junior Winter Playing History
| Games as Player |
Games Won | Games Drawn | Games Lost | Total | Goals | Goalscoring Average |
|---|---|---|---|---|---|---|
| Junior Winter | 13 | 2 | 40 | 55 | 4 | 0.075 |
| First Game : | Hawthorn 2 def. Melton 1. R-01: 2006 U13 Pennant North |
| Last Game : | Melton 5 def. Brunswick 0. GF: 2010 U17 West |
| Best Win : | Melton 8 def. MUHC 0. R-07: 2007 U15 North |
| Worst Loss : | St.Bernards 10 def. Melton 0. R-04: 2008 U15 Pennant North |
| 1 goal games : | 1 times. Last : Melton 8 def. MUHC 0. R-07: 2007 U15 North |
| 3 goal games : | 1 times. Last : Melton 5 def. Werribee 2. R-13: 2010 U17 West |
| Finals : | Melton 5 def. Brunswick 0. GF: 2010 U17 West Melton 5 def. PEGS 0. SF: 2010 U17 West |
| Premierships : | Melton 5 def. Brunswick 0. GF: 2010 U17 West |
Junior Summer Playing History
| Games as Player |
Games Won | Games Drawn | Games Lost | Total | Goals | Goalscoring Average |
|---|---|---|---|---|---|---|
| Junior Summer | 2 | 1 | 2 | 5 | 0 | 0.000 |
| First Game : | Melton 1 def. Kew 0. R-01: 2008/09 SHC-2 Under 15 |
| Last Game : | Southern United 6 def. Melton 1. R-07: 2008/09 SHC-2 Under 15 |
| Best Win : | Melton 3 def. Southern United 1. R-02: 2008/09 SHC-2 Under 15 |
| Worst Loss : | Southern United 6 def. Melton 1. R-07: 2008/09 SHC-2 Under 15 |
| Finals : | None. |
| Premierships : | None. |
Senior Winter Playing History
| Games as Player |
Games Won | Games Drawn | Games Lost | Total | Goals | Goalscoring Average |
|---|---|---|---|---|---|---|
| Senior Winter | 46 | 18 | 62 | 126 | 14 | 0.111 |
| First Game : | Powerhouse 8 def. Melton 1. R-14: 2008 Metro 3 West Men |
| Last Game : | WestVic 6 def. Melton 3. R-10: 2021 Vic League 3 Men |
| Best Win : | Melton 12 def. Craigieburn 0. R-06: 2021 Pennant G Men |
| Worst Loss : | RMIT 9 def. Melton 0. R-04: 2018 Pennant G Men |
| 1 goal games : | 9 times. Last : Melton 5 def. Footscray 1. R-03: 2021 Metro B North/West Men |
| 2 goal games : | 1 times. Last : Melton 9 def. Kew 1. R-09: 2011 Metro 2 West Men |
| 3 goal games : | 1 times. Last : Melton 8 def. RMIT 5. R-01: 2009 Metro 3 West Men |
| Finals : | Essendon 2 def. Melton 1. PF: 2011 Metro 2 West Men MCC 4 def. Melton 0. QF: 2011 Metro 2 West Men Swinburne 3 def. Melton 1. EF: 2017 Vic League 3 Res. Men |
| Premierships : | None. |
Senior Summer Playing History
| Games as Player |
Games Won | Games Drawn | Games Lost | Total | Goals | Goalscoring Average |
|---|---|---|---|---|---|---|
| Senior Summer | 1 | 0 | 9 | 10 | 2 | 0.200 |
| First Game : | Footscray (R) 5 def. Melton 1. R-01: 2012/13 Footscray Summer |
| Last Game : | AHCOC 8 def. Melton 6. R-10: 2012/13 Footscray Summer |
| Best Win : | Melton 4 def. Altona 3. R-09: 2012/13 Footscray Summer |
| Worst Loss : | Footscray (R) 9 def. Melton 1. R-06: 2012/13 Footscray Summer |
| 2 goal games : | 1 times. Last : AHCOC 8 def. Melton 6. R-10: 2012/13 Footscray Summer |
| Finals : | None. |
| Premierships : | None. |
Teammates
Number of teammates :128
| Player |
Games |
Win % | Draw % | Loss % | Unkn % | Avge. Points |
Avge. For | Avge. Aga | Avge. Diff. |
|---|---|---|---|---|---|---|---|---|---|
| Kelly, Bo* | 102 | 32% | 13% | 55% | 1.098 | 2.049 | 2.775 | -0.725 | |
| Salvatore, Aaron* | 78 | 29% | 8% | 63% | 0.962 | 1.872 | 3.064 | -1.192 | |
| Self, Ryan* | 76 | 32% | 12% | 57% | 1.066 | 2.329 | 3.171 | -0.842 | |
| Strebs-Stelps, Ben* | 68 | 28% | 15% | 57% | 0.985 | 2.294 | 3.265 | -0.971 | |
| McMurrie, Tom* | 65 | 26% | 5% | 69% | 0.831 | 1.646 | 3.338 | -1.692 | |
| Arnold, Andrew* | 63 | 24% | 16% | 60% | 0.873 | 1.841 | 3.079 | -1.238 | |
| Scalzo, Mark* | 61 | 31% | 8% | 61% | 1.016 | 2.049 | 3.131 | -1.082 | |
| Vallance, Liam* | 57 | 30% | 9% | 61% | 0.982 | 1.526 | 2.842 | -1.316 | |
| Hanley-Wood, Ben* | 55 | 22% | 20% | 58% | 0.855 | 1.945 | 3.018 | -1.073 | |
| Hooley, Aidan* | 49 | 27% | 4% | 69% | 0.837 | 1.429 | 3.327 | -1.898 | |
| Jackson, Taylor* | 49 | 20% | 4% | 76% | 0.653 | 1.367 | 3.327 | -1.959 | |
| Knipe, Jessica* | 46 | 26% | 7% | 67% | 0.848 | 1.391 | 3.348 | -1.957 | |
| Noonan, Kristian* | 45 | 29% | 22% | 49% | 1.089 | 1.933 | 2.400 | -0.467 | |
| Slocombe, Morgan* | 43 | 23% | 19% | 58% | 0.884 | 1.837 | 3.442 | -1.605 | |
| Lawrence, Hayden* | 43 | 44% | 7% | 49% | 1.395 | 2.907 | 2.442 | +0.465 | |
| Goss, Matthew* | 41 | 10% | 5% | 85% | 0.341 | 0.976 | 3.707 | -2.732 | |
| Mumford, Matthew* | 41 | 29% | 20% | 51% | 1.073 | 1.976 | 2.780 | -0.805 | |
| Lawrence, Stephen* | 40 | 48% | 10% | 43% | 1.525 | 3.025 | 2.500 | +0.525 | |
| Lawrence, Riley* | 40 | 40% | 10% | 50% | 1.300 | 2.925 | 2.700 | +0.225 | |
| McLaren, Scott* | 38 | 45% | 13% | 42% | 1.474 | 2.947 | 2.237 | +0.711 | |
| Kasprzak, Kathryn* | 37 | 24% | 5% | 70% | 0.784 | 1.486 | 3.378 | -1.892 | |
| Baker, Daniel* | 37 | 30% | 19% | 51% | 1.081 | 2.081 | 2.703 | -0.622 | |
| Lawrence, Jesse* | 37 | 46% | 5% | 49% | 1.432 | 2.757 | 2.486 | +0.270 | |
| Grant-Taylor, Lexi* | 33 | 24% | 3% | 73% | 0.758 | 1.515 | 3.606 | -2.091 | |
| Arnold, Chris* | 33 | 36% | 21% | 42% | 1.303 | 2.455 | 2.485 | -0.030 | |
| Hosking, Michael* | 33 | 30% | 15% | 55% | 1.061 | 2.061 | 2.667 | -0.606 | |
| Crebbin, Jason* | 32 | 28% | 16% | 56% | 1.000 | 2.531 | 3.625 | -1.094 | |
| Strobel, Joshua* | 32 | 41% | 13% | 47% | 1.344 | 2.844 | 2.531 | +0.313 | |
| Kelly, Lee* | 30 | 47% | 17% | 37% | 1.567 | 2.833 | 2.100 | +0.733 | |
| Lawrence, Tejay* | 30 | 43% | 10% | 47% | 1.400 | 3.033 | 2.600 | +0.433 | |
| Currie, Fraser* | 29 | 41% | 3% | 55% | 1.276 | 2.414 | 2.552 | -0.138 | |
| Lawrence, Richard* | 28 | 39% | 21% | 39% | 1.393 | 2.571 | 2.393 | +0.179 | |
| MacKenzie, Darren* | 28 | 43% | 4% | 54% | 1.321 | 2.857 | 2.679 | +0.179 | |
| Oataway, Anthony* | 27 | 11% | 7% | 81% | 0.407 | 0.889 | 3.704 | -2.815 | |
| Clough, Jarryd* | 27 | 44% | 7% | 48% | 1.407 | 3.185 | 3.481 | -0.296 | |
| Holahan, Zac* | 27 | 44% | 7% | 48% | 1.407 | 2.593 | 2.333 | +0.259 | |
| Murphy, Mathew* | 26 | 46% | 15% | 38% | 1.538 | 2.962 | 1.885 | +1.077 | |
| McMurrie, Michael* | 25 | 32% | 12% | 56% | 1.080 | 2.160 | 3.640 | -1.480 | |
| Fleming, Ashleigh* | 23 | 9% | 4% | 87% | 0.304 | 0.652 | 4.130 | -3.478 | |
| VellaVanKassel, Nick* | 23 | 35% | 4% | 61% | 1.087 | 2.261 | 3.913 | -1.652 | |
| Brazil, Sean* | 22 | 27% | 18% | 55% | 1.000 | 2.000 | 3.409 | -1.409 | |
| Gati, Nick* | 21 | 24% | 19% | 57% | 0.905 | 1.905 | 2.810 | -0.905 | |
| Lawrence, Geoffrey* | 21 | 48% | 24% | 29% | 1.667 | 2.905 | 2.238 | +0.667 | |
| Azzopardi, Justin* | 20 | 45% | 10% | 45% | 1.450 | 3.100 | 2.900 | +0.200 | |
| Kovarik, John* | 19 | 37% | 63% | 1.105 | 1.947 | 2.789 | -0.842 | ||
| Lawrence, Glenn* | 19 | 47% | 21% | 32% | 1.632 | 3.368 | 2.053 | +1.316 | |
| Vallance, Lachlan* | 19 | 47% | 5% | 47% | 1.474 | 2.842 | 2.526 | +0.316 | |
| Simpson, Matthew* | 18 | 28% | 11% | 61% | 0.944 | 2.222 | 1.944 | +0.278 | |
| McMurrie, Andrew* | 17 | 12% | 88% | 0.353 | 1.118 | 3.882 | -2.765 | ||
| Jaros, Noah* | 17 | 18% | 12% | 71% | 0.647 | 0.706 | 4.000 | -3.294 | |
| Downs, Andrew* | 17 | 47% | 24% | 29% | 1.647 | 3.176 | 1.765 | +1.412 | |
| Bentley, Myles* | 17 | 24% | 12% | 65% | 0.824 | 2.118 | 3.471 | -1.353 | |
| James, Daniel* | 16 | 38% | 13% | 50% | 1.250 | 2.938 | 2.938 | +0.000 | |
| Kasprzak, Marcus* | 15 | 53% | 7% | 40% | 1.667 | 2.133 | 1.600 | +0.533 | |
| Medley, Corey* | 15 | 13% | 87% | 0.400 | 1.200 | 3.733 | -2.533 | ||
| Armitage, Timothy* | 15 | 33% | 13% | 53% | 1.133 | 2.133 | 3.133 | -1.000 | |
| Carpenter, Dale* | 14 | 21% | 79% | 0.643 | 1.429 | 2.786 | -1.357 | ||
| Hardy, Jasmin* | 14 | 21% | 79% | 0.643 | 1.429 | 2.786 | -1.357 | ||
| Vallance, Hayley* | 14 | 21% | 79% | 0.643 | 1.429 | 2.786 | -1.357 | ||
| Downs, Cassandra* | 14 | 14% | 86% | 0.429 | 1.214 | 3.786 | -2.571 | ||
| Murphy, Craig* | 14 | 21% | 14% | 64% | 0.786 | 1.714 | 2.714 | -1.000 | |
| Armitage, Callan* | 14 | 36% | 64% | 1.071 | 2.143 | 2.643 | -0.500 | ||
| Powderly, Joshua* | 12 | 17% | 83% | 0.500 | 1.250 | 3.250 | -2.000 | ||
| Arnold, David* | 12 | 25% | 17% | 58% | 0.917 | 1.917 | 2.583 | -0.667 | |
| Shadbolt, Ron* | 12 | 25% | 8% | 67% | 0.833 | 2.000 | 2.833 | -0.833 | |
| Bluschke, Glen* | 11 | 9% | 91% | 0.273 | 1.091 | 3.182 | -2.091 | ||
| Hardy, Madeline* | 11 | 18% | 82% | 0.545 | 1.364 | 3.091 | -1.727 | ||
| Medley, Daniel* | 11 | 100% | 0.000 | 0.455 | 4.545 | -4.091 | |||
| Lawrence, Tony* | 11 | 18% | 9% | 73% | 0.636 | 2.182 | 3.818 | -1.636 | |
| Strebs-Stelps, Leo* | 11 | 9% | 9% | 82% | 0.364 | 1.909 | 5.909 | -4.000 | |
| Sorensen, Steven* | 10 | 40% | 20% | 40% | 1.400 | 2.100 | 1.900 | +0.200 | |
| Bell, Ray* | 10 | 20% | 20% | 60% | 0.800 | 2.100 | 2.500 | -0.400 | |
| McMillan, Brent* | 10 | 60% | 40% | 1.800 | 2.600 | 1.900 | +0.700 | ||
| Salvatore, Joel* | 10 | 20% | 10% | 70% | 0.700 | 2.200 | 3.900 | -1.700 | |
| Shadbolt, Megan* | 9 | 78% | 22% | 2.333 | 3.444 | 1.111 | +2.333 | ||
| Hays, Jenna* | 8 | 13% | 88% | 0.375 | 1.750 | 4.500 | -2.750 | ||
| Cook, Stuart* | 8 | 25% | 75% | 0.750 | 2.000 | 3.375 | -1.375 | ||
| Knipe, Lucas* | 8 | 38% | 13% | 50% | 1.250 | 1.625 | 2.500 | -0.875 | |
| Kovarik, Hans* | 8 | 25% | 13% | 63% | 0.875 | 2.375 | 2.625 | -0.250 | |
| May, Adrian* | 8 | 50% | 50% | 1.500 | 3.000 | 2.875 | +0.125 | ||
| Eastwell, Josh* | 8 | 50% | 50% | 1.500 | 2.875 | 2.625 | +0.250 | ||
| Hooley, Ryan* | 7 | 29% | 14% | 57% | 1.000 | 1.857 | 2.714 | -0.857 | |
| James, William* | 7 | 57% | 43% | 1.714 | 3.714 | 2.571 | +1.143 | ||
| Knight, Jason* | 7 | 29% | 14% | 57% | 1.000 | 2.143 | 3.143 | -1.000 | |
| Hobbs, Neil* | 6 | 17% | 17% | 67% | 0.667 | 2.333 | 3.833 | -1.500 | |
| Lawrence, Darcy* | 5 | 20% | 80% | 0.200 | 2.400 | 5.200 | -2.800 | ||
| Hu, Chun-Che* | 5 | 40% | 60% | 1.200 | 3.200 | 2.400 | +0.800 | ||
| O`Brien, Melissa* | 4 | 100% | 0.000 | 1.250 | 7.000 | -5.750 | |||
| Moroney, Jason | 4 | 25% | 75% | 0.750 | 3.000 | 5.500 | -2.500 | ||
| Stanyer, Adrian* | 4 | 25% | 50% | 25% | 1.250 | 1.750 | 1.750 | +0.000 | |
| Lawrence, Brody* | 4 | 100% | 3.000 | 6.750 | 1.250 | +5.500 | |||
| Micallef, Levi* | 4 | 100% | 3.000 | 6.750 | 1.250 | +5.500 | |||
| Micallef, Reuben* | 4 | 100% | 3.000 | 6.750 | 1.250 | +5.500 | |||
| Anderson, Matthew* | 3 | 100% | 0.000 | 1.667 | 5.000 | -3.333 | |||
| Darcy, Astin* | 3 | 100% | 0.000 | 0.667 | 3.000 | -2.333 | |||
| Lawrence, Daryl* | 3 | 67% | 33% | 2.333 | 6.667 | 2.000 | +4.667 | ||
| Knight, Tristan* | 3 | 33% | 67% | 1.000 | 1.000 | 2.667 | -1.667 | ||
| Bairstow, Michael* | 3 | 67% | 33% | 2.000 | 3.333 | 2.000 | +1.333 | ||
| Abraham, Liam* | 3 | 67% | 33% | 2.000 | 4.333 | 3.333 | +1.000 | ||
| Dine, Brenton* | 2 | 100% | 0.000 | 0.500 | 5.000 | -4.500 | |||
| Carroll, James | 2 | 50% | 50% | 0.500 | 1.000 | 3.500 | -2.500 | ||
| Bennett, Graeme* | 2 | 50% | 50% | 0.500 | 1.500 | 2.500 | -1.000 | ||
| Haycock, John* | 2 | 100% | 0.000 | 0.500 | 2.000 | -1.500 | |||
| Tannenberg, Luke | 2 | 50% | 50% | 2.000 | 2.500 | 1.500 | +1.000 | ||
| Hart, Liam* | 2 | 100% | 0.000 | 0.000 | 3.500 | -3.500 | |||
| Buttigieg, William* | 2 | 50% | 50% | 2.000 | 1.500 | 0.000 | +1.500 | ||
| Caiafa, Sebastian* | 2 | 50% | 50% | 1.500 | 4.000 | 3.000 | +1.000 | ||
| Nurse, Cameron* | 2 | 50% | 50% | 1.500 | 4.000 | 3.000 | +1.000 | ||
| Sutton, Shaun* | 2 | 100% | 0.000 | 0.500 | 3.000 | -2.500 | |||
| Brown, Daniel* | 2 | 50% | 50% | 1.500 | 2.500 | 2.000 | +0.500 | ||
| Burgan, Deeon | 2 | 50% | 50% | 1.500 | 2.500 | 2.000 | +0.500 | ||
| Downs, David* | 1 | 100% | 0.000 | 1.000 | 8.000 | -7.000 | |||
| Hoad, Simon* | 1 | 100% | 0.000 | 1.000 | 8.000 | -7.000 | |||
| Court, Andrew | 1 | 100% | 0.000 | 0.000 | 2.000 | -2.000 | |||
| Baker, Gavin* | 1 | 100% | 0.000 | 0.000 | 4.000 | -4.000 | |||
| Rodrigues, Errol* | 1 | 100% | 3.000 | 8.000 | 5.000 | +3.000 | |||
| Greed, Justin* | 1 | 100% | 1.000 | 2.000 | 2.000 | +0.000 | |||
| Hobbs, Brad* | 1 | 100% | 0.000 | 0.000 | 9.000 | -9.000 | |||
| Nadaraja, Derick | 1 | 100% | 1.000 | 1.000 | 1.000 | +0.000 | |||
| Granville, Alan* | 1 | 100% | 1.000 | 2.000 | 2.000 | +0.000 | |||
| Griffiths, Rylee* | 1 | 100% | 3.000 | 5.000 | 1.000 | +4.000 | |||
| Trevarthen, Jason* | 1 | 100% | 0.000 | 0.000 | 5.000 | -5.000 | |||
| Gregorio, Callum* | 1 | 100% | 3.000 | 5.000 | 1.000 | +4.000 | |||
| Kuchel, Joshua* | 1 | 100% | 3.000 | 5.000 | 1.000 | +4.000 | |||
| Blackwell, Grahame* | 1 | 100% | 0.000 | 0.000 | 3.000 | -3.000 | |||
| Bonnici, Brad* | 1 | 100% | 0.000 | 0.000 | 3.000 | -3.000 | |||
| James, Jeff* | 1 | 100% | 0.000 | 0.000 | 3.000 | -3.000 | |||
| Taylor, Harvey* | 1 | 100% | 0.000 | 0.000 | 3.000 | -3.000 |
Opposition Teams
| Opponent |
Games |
Goals | Avge |
Win % | Draw % | Loss % | Unkn % | Avge. Points |
Avge. For | Avge. Aga | Avge. Diff. |
G.K. Games | Shut- outs | Shut- out % | Goals In | Goals Avge |
|---|---|---|---|---|---|---|---|---|---|---|---|---|---|---|---|---|
| St.Bernards | 13 | 8% | 92% | 0.231 | 0.923 | 5.231 | -4.308 | |||||||||
| RMIT | 11 | 4 | 0.364 | 73% | 9% | 18% | 2.273 | 3.455 | 2.364 | +1.091 | ||||||
| Greensborough | 10 | 20% | 10% | 70% | 0.700 | 1.300 | 2.600 | -1.300 | ||||||||
| PEGS | 10 | 2 | 0.200 | 30% | 20% | 50% | 1.100 | 2.100 | 2.800 | -0.700 | ||||||
| Powerhouse | 9 | 1 | 0.111 | 22% | 78% | 0.667 | 2.222 | 4.000 | -1.778 | |||||||
| Essendon | 9 | 11% | 11% | 78% | 0.444 | 0.556 | 3.000 | -2.444 | ||||||||
| Footscray | 9 | 1 | 0.111 | 22% | 11% | 67% | 0.778 | 2.000 | 4.778 | -2.778 | ||||||
| ECHO | 9 | 22% | 22% | 56% | 0.889 | 2.000 | 2.556 | -0.556 | ||||||||
| Collegians-X | 8 | 1 | 0.125 | 50% | 13% | 38% | 1.625 | 2.625 | 1.750 | +0.875 | ||||||
| Kew | 6 | 2 | 0.333 | 33% | 17% | 50% | 1.167 | 2.500 | 2.333 | +0.167 | ||||||
| Altona | 6 | 1 | 0.167 | 33% | 67% | 1.000 | 1.833 | 2.500 | -0.667 | |||||||
| Swinburne | 6 | 33% | 33% | 33% | 1.333 | 2.333 | 2.500 | -0.167 | ||||||||
| Hawthorn | 5 | 40% | 20% | 40% | 1.400 | 2.200 | 2.400 | -0.200 | ||||||||
| Werribee | 5 | 3 | 0.600 | 40% | 60% | 1.200 | 2.400 | 3.000 | -0.600 | |||||||
| Brunswick | 5 | 60% | 40% | 1.800 | 1.800 | 1.200 | +0.600 | |||||||||
| Box Hill | 5 | 20% | 40% | 40% | 1.000 | 2.200 | 2.600 | -0.400 | ||||||||
| Old Haileybury | 5 | 60% | 40% | 1.800 | 2.800 | 2.000 | +0.800 | |||||||||
| Old Melburnians | 5 | 1 | 0.200 | 60% | 40% | 1.800 | 4.600 | 2.200 | +2.400 | |||||||
| Doncaster | 4 | 100% | 0.000 | 1.250 | 2.500 | -1.250 | ||||||||||
| MUHC | 4 | 1 | 0.250 | 50% | 25% | 25% | 1.750 | 3.250 | 0.750 | +2.500 | ||||||
| Dandenong | 4 | 100% | 0.000 | 1.250 | 5.500 | -4.250 | ||||||||||
| Craigieburn | 4 | 1 | 0.250 | 50% | 50% | 1.500 | 4.500 | 2.250 | +2.250 | |||||||
| Vic Sihks | 3 | 100% | 0.000 | 1.333 | 3.667 | -2.333 | ||||||||||
| Bendigo | 3 | 33% | 67% | 0.333 | 1.667 | 3.333 | -1.667 | |||||||||
| Bayside | 3 | 33% | 67% | 1.667 | 1.667 | 1.000 | +0.667 | |||||||||
| Ajax-Maccabi | 2 | 50% | 50% | 1.500 | 2.000 | 2.000 | +0.000 | |||||||||
| Loyola College | 2 | 50% | 50% | 1.500 | 1.000 | 0.500 | +0.500 | |||||||||
| Yarra Valley | 2 | 100% | 0.000 | 0.500 | 6.000 | -5.500 | ||||||||||
| Geelong | 2 | 100% | 0.000 | 1.000 | 6.000 | -5.000 | ||||||||||
| Southern United | 2 | 50% | 50% | 1.500 | 2.000 | 3.500 | -1.500 | |||||||||
| Old Carey | 2 | 50% | 50% | 0.500 | 2.500 | 3.000 | -0.500 | |||||||||
| MCC | 2 | 100% | 0.000 | 1.000 | 5.500 | -4.500 | ||||||||||
| St.Bedes | 2 | 50% | 50% | 0.500 | 0.500 | 1.500 | -1.000 | |||||||||
| Baw-Baw | 2 | 100% | 0.000 | 0.500 | 3.000 | -2.500 | ||||||||||
| AHCOC | 2 | 2 | 1.000 | 100% | 0.000 | 4.500 | 7.500 | -3.000 | ||||||||
| Croydon | 2 | 100% | 3.000 | 3.500 | 0.500 | +3.000 | ||||||||||
| Hume | 2 | 100% | 0.000 | 2.000 | 4.500 | -2.500 | ||||||||||
| Maccabi | 2 | 100% | 3.000 | 3.500 | 1.500 | +2.000 | ||||||||||
| Marcellin | 1 | 100% | 0.000 | 0.000 | 2.000 | -2.000 | ||||||||||
| Ballarat Students | 1 | 100% | 3.000 | 2.000 | 0.000 | +2.000 | ||||||||||
| Frankston | 1 | 100% | 0.000 | 3.000 | 5.000 | -2.000 | ||||||||||
| Caroline Springs | 1 | 100% | 3.000 | 1.000 | 0.000 | +1.000 | ||||||||||
| Glen Eira | 1 | 100% | 3.000 | 8.000 | 1.000 | +7.000 | ||||||||||
| WestVic | 1 | 100% | 0.000 | 3.000 | 6.000 | -3.000 | ||||||||||
| Waverley | 1 | 100% | 3.000 | 4.000 | 1.000 | +3.000 | ||||||||||
| Maccabbi | 1 | 100% | 3.000 | 6.000 | 3.000 | +3.000 | ||||||||||
| Whittlesea | 1 | 100% | 0.000 | 0.000 | 3.000 | -3.000 | ||||||||||
| Opponents :47 | 196 | 20 | 0.102 | 32% | 11% | 58% | 1.056 | 2.128 | 2.964 | -0.837 |
Playing Venues
| Venue | Games |
Goals | Avge. |
Win % | Draw % | Loss % | Unkn % | Avge. Points |
Avge. For | Avge. Aga | Avge. Diff. |
G.K. Games | Shut- outs | Shut- out % | Goals In | Goals Avge. |
|---|---|---|---|---|---|---|---|---|---|---|---|---|---|---|---|---|
| Melton Mowbray | 63 | 9 | 0.143 | 38% | 10% | 52% | 1.238 | 1.984 | 2.571 | -0.587 | ||||||
| Melton | 25 | 2 | 0.080 | 40% | 12% | 48% | 1.320 | 2.880 | 2.640 | +0.240 | ||||||
| SHC | 16 | 38% | 19% | 44% | 1.313 | 1.750 | 2.125 | -0.375 | ||||||||
| Footscray | 16 | 2 | 0.125 | 19% | 6% | 75% | 0.625 | 2.313 | 5.125 | -2.813 | ||||||
| St.Bernards | 7 | 14% | 86% | 0.429 | 1.000 | 5.143 | -4.143 | |||||||||
| Albert Park | 6 | 1 | 0.167 | 50% | 50% | 1.500 | 3.167 | 2.333 | +0.833 | |||||||
| Elgar Park | 6 | 2 | 0.333 | 33% | 67% | 1.000 | 2.833 | 2.500 | +0.333 | |||||||
| Greensborough | 4 | 25% | 75% | 0.250 | 1.250 | 3.500 | -2.250 | |||||||||
| Melbourne Uni | 4 | 25% | 75% | 0.250 | 1.000 | 2.250 | -1.250 | |||||||||
| Essendon | 4 | 25% | 25% | 50% | 1.000 | 1.750 | 1.250 | +0.500 | ||||||||
| PEGS | 4 | 1 | 0.250 | 25% | 75% | 0.250 | 1.000 | 4.250 | -3.250 | |||||||
| Hawthorn | 3 | 33% | 67% | 1.000 | 1.667 | 3.333 | -1.667 | |||||||||
| Melb Grammar | 3 | 67% | 33% | 2.000 | 5.333 | 2.333 | +3.000 | |||||||||
| Waverley | 3 | 100% | 0.000 | 2.333 | 4.667 | -2.333 | ||||||||||
| Monash | 3 | 67% | 33% | 2.000 | 3.667 | 2.000 | +1.667 | |||||||||
| Hume | 3 | 33% | 67% | 1.000 | 2.000 | 3.000 | -1.000 | |||||||||
| Werribee | 2 | 3 | 1.500 | 50% | 50% | 1.500 | 2.500 | 3.500 | -1.000 | |||||||
| Bendigo | 2 | 50% | 50% | 0.500 | 1.500 | 3.500 | -2.000 | |||||||||
| Brunswick | 2 | 50% | 50% | 1.500 | 1.500 | 2.000 | -0.500 | |||||||||
| Melbourne High | 2 | 100% | 0.000 | 1.000 | 5.500 | -4.500 | ||||||||||
| Haileybury | 2 | 50% | 50% | 1.500 | 3.000 | 3.000 | +0.000 | |||||||||
| Koonung | 2 | 50% | 50% | 0.500 | 0.000 | 1.000 | -1.000 | |||||||||
| Dandenong | 2 | 100% | 0.000 | 0.500 | 4.000 | -3.500 | ||||||||||
| Yarra Valley | 1 | 100% | 0.000 | 1.000 | 3.000 | -2.000 | ||||||||||
| Reservoir | 1 | 100% | 0.000 | 1.000 | 3.000 | -2.000 | ||||||||||
| Geelong | 1 | 100% | 0.000 | 1.000 | 6.000 | -5.000 | ||||||||||
| Altona | 1 | 100% | 1.000 | 2.000 | 2.000 | +0.000 | ||||||||||
| Not Recorded | 1 | 100% | 3.000 | 5.000 | 0.000 | +5.000 | ||||||||||
| Mentone | 1 | 100% | 1.000 | 1.000 | 1.000 | +0.000 | ||||||||||
| Churchill | 1 | 100% | 0.000 | 0.000 | 3.000 | -3.000 | ||||||||||
| Frankston | 1 | 100% | 0.000 | 3.000 | 5.000 | -2.000 | ||||||||||
| Yarra Grammar | 1 | 100% | 3.000 | 4.000 | 1.000 | +3.000 | ||||||||||
| Ballarat | 1 | 100% | 0.000 | 3.000 | 6.000 | -3.000 | ||||||||||
| Elwood | 1 | 100% | 3.000 | 6.000 | 3.000 | +3.000 | ||||||||||
| Bundoora | 1 | 100% | 0.000 | 0.000 | 3.000 | -3.000 | ||||||||||
| Venues :35 | 196 | 20 | 0.102 | 32% | 11% | 58% | 1.056 | 2.128 | 2.964 | -0.837 |