 |
Melton Hockey Club |
|
Last updated : 4:35 pm - 17 April 2024

Club Cap : 600
(Games : 256, Goals : 60 )
First XI Men's Cap : 143
(Games : 20, Goals : 1)
Games Umpired : 82
(Senior : 20, Veteran : 6, Junior : 56)
Milestones
| 2004-Apr-24 : | First Junior game (Melton 0 drew Footscray (B) 0. R-02: 2004 U11 North) |
| 2004-Apr-24 : | First game (Melton 0 drew Footscray (B) 0. R-02: 2004 U11 North) |
| 2004-Jun-05 : | First goal scored (Melton 6 def. Altona 0. R-08: 2004 U11 North) |
| 2006-Jun-17 : | First game umpired (Altona (S) 1 def. Melton 0. R-08: 2006 U9 West) |
| 2006-Aug-25 : | 50 Junior games (Melton 2 drew Werribee 2. R-17: 2006 U13 Pennant North) |
| 2008-Jun-28 : | First Senior game (Melton 4 def. Old Melburnians 1. R-10: 2008 Metro 3 West Men) |
| 2009-Aug-21 : | 100 Junior games (Melton 2 def. St.Bernards (2) 0. R-16: 2009 U15 West) |
| 2011-Sep-16 : | Last Junior game (PEGS 8 def. Melton 0. GF: 2011 U17 West) |
| 2013-Apr-13 : | First First XI Mens game (Melton 1 def. Collegians-X 0. R-01: 2013 Vic League 3 Men) |
| 2013-Jun-01 : | First Senior goal (ECHO 4 def. Melton 3. R-08: 2013 Vic League 3 Res. Men) |
| 2018-Jun-30 : | Last First XI Mens game played (St.Bernards 5 def. Melton 2. R-11: 2018 Vic League 3 Men) |
| 2024-Apr-13 : | Last Senior game (Melton 3 def. Caroline Springs 0. R-01: 2024 Metro 1 North/West Men) |
| 2024-Apr-13 : | Last game played (Melton 3 def. Caroline Springs 0. R-01: 2024 Metro 1 North/West Men) |
| 2024-Apr-15 : | Last game umpired (Melton 2 drew Footscray 2. R-01: 2024 Masters 45+ North/West) |
Honours, Trophies, and Official Roles
| Best and Fairest : | 2009-U15 West, 2010-U17 West |
| B&F Runner Up : | 2008-U15 Pennant North |
| Captain : | 2011-U17 West |
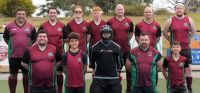
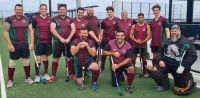
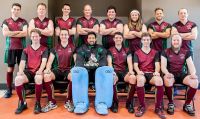
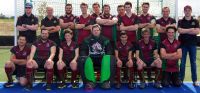
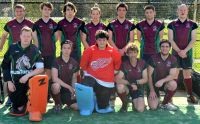
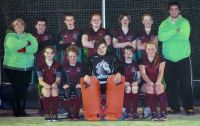
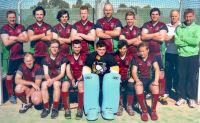
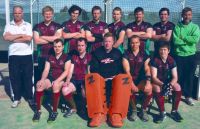
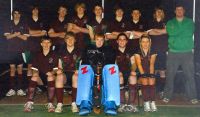
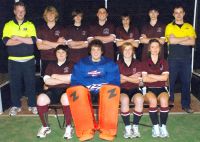
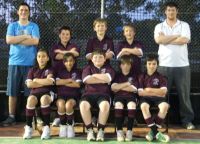
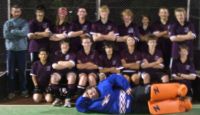
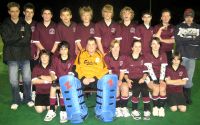
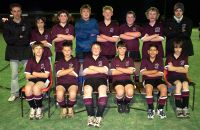
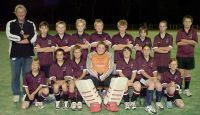
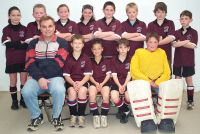
Team Photographs
Complete Playing History
Teams played with : 27
Premierships won : 1
Wooden Spoons : 0
| Games as Player |
Games Won | Games Drawn | Games Lost | Total | Goals | Goalscoring Average |
|---|---|---|---|---|---|---|
| Junior Winter | 63 | 20 | 52 | 135 | 42 | 0.318 |
| Junior Summer | 0 | 0 | 1 | 1 | 0 | 0.000 |
| Junior Total | 63 | 20 | 53 | 136 | 42 | 0.316 |
| Senior Winter | 47 | 16 | 57 | 120 | 18 | 0.153 |
| Total | 110 | 36 | 110 | 256 | 60 | 0.239 |
| Pos. | PR/WS | Div. | Competition | Games | Goals | Avge. | Won | Drawn | Lost | Avge.For | Avge.Aga | Avge.Diff | G.For | G.Aga | GoalDiff |
|---|---|---|---|---|---|---|---|---|---|---|---|---|---|---|---|
| ? | 2024 Metro 1 North/West Men | 1 | 1 | 3.000 | 0.000 | +3.000 | 3 | 0 | +003 | ||||||
| 6 | 2023 Pennant E North/West Men* | 10 | 6 | 1 | 3 | 3.300 | 2.100 | +1.200 | 33 | 21 | +012 | ||||
| 7 | 2023 Metro 2 North/West Men* | 2 | 1 | 0.500 | 1 | 1 | 3.000 | 3.500 | -0.500 | 6 | 7 | -001 | |||
| 3 | 2022 Pennant E North/West Men* | 1 | 1 | 2.000 | 7.000 | -5.000 | 2 | 7 | -005 | ||||||
| 9 | 2022 Metro 2 North/West Men* | 8 | 3 | 0.375 | 1 | 7 | 1.500 | 3.500 | -2.000 | 12 | 28 | -016 | |||
| 1 | 2021 Pennant G Men* | 2 | 2 | 4.500 | 1.500 | +3.000 | 9 | 3 | +006 | ||||||
| 6 | 2021 Metro B North/West Men* | 7 | 1 | 0.143 | 2 | 1 | 4 | 1.714 | 1.571 | +0.143 | 12 | 11 | +001 | ||
| 5 | 2018 Vic League 3 Men* | 9 | 1 | 0.111 | 5 | 4 | 4.000 | 2.222 | +1.778 | 36 | 20 | +016 | |||
| 6 | 2018 Pennant G Men* | 9 | 1 | 0.111 | 2 | 1 | 6 | 2.000 | 4.222 | -2.222 | 18 | 38 | -020 | ||
| 4 | 2017 Vic League 3 Res. Men* | 18 | 1 | 0.056 | 6 | 2 | 10 | 2.444 | 2.611 | -0.167 | 44 | 47 | -003 | ||
| 3 | 2014 Vic League 3 Res. Men* | 15 | 6 | 0.400 | 8 | 3 | 4 | 2.733 | 1.333 | +1.400 | 41 | 20 | +021 | ||
| 6 | 2014 Metro 3 West Men* | 5 | 2 | 0.400 | 3 | 1 | 1 | 3.400 | 2.400 | +1.000 | 17 | 12 | +005 | ||
| 6 | 2013 Vic League 3 Men* | 11 | 3 | 3 | 5 | 2.091 | 2.727 | -0.636 | 23 | 30 | -007 | ||||
| 7 | 2013 Vic League 3 Res. Men* | 11 | 2 | 0.182 | 5 | 1 | 5 | 2.818 | 2.545 | +0.273 | 31 | 28 | +003 | ||
| 3 | 2011 Metro 2 West Men* | 2 | 2 | 3.000 | 1.000 | +2.000 | 6 | 2 | +004 | ||||||
| 2 | 2011 U17 West* | 18 | 3 | 0.167 | 10 | 2 | 6 | 2.778 | 2.167 | +0.611 | 50 | 39 | +011 | ||
| 7 | 2010 Metro 3 West Men* | 2 | 1 | 1 | 1.500 | 5.500 | -4.000 | 3 | 11 | -008 | |||||
| 1 | PR | 2010 U17 West* | 15 | 5 | 0.333 | 9 | 3 | 3 | 2.800 | 1.800 | +1.000 | 42 | 27 | +015 | |
| 7 | 2009 Metro 3 West Men* | 2 | 1 | 1 | 1.500 | 1.500 | +0.000 | 3 | 3 | +000 | |||||
| 4 | 2009 U15 West* | 17 | 8 | 0.471 | 8 | 3 | 6 | 2.529 | 1.882 | +0.647 | 43 | 32 | +011 | ||
| 6 | 2008/09 SHC-2 Under 15* | 1 | 1 | 0.000 | 4.000 | -4.000 | 0 | 4 | -004 | ||||||
| 9 | 2008 Metro 3 West Men* | 5 | 1 | 4 | 0.800 | 4.000 | -3.200 | 4 | 20 | -016 | |||||
| 9 | 2008 U15 Pennant North* | 16 | 1 | 2 | 13 | 0.563 | 4.313 | -3.750 | 9 | 69 | -060 | ||||
| 2 | 2007 U13 Pennant North* | 18 | 4 | 0.222 | 12 | 3 | 3 | 2.778 | 1.278 | +1.500 | 50 | 23 | +027 | ||
| 8 | 2006 U13 Pennant North* | 18 | 4 | 0.222 | 3 | 2 | 13 | 1.278 | 2.778 | -1.500 | 23 | 50 | -027 | ||
| 3 | 2005 U11 Pennant North* | 17 | 12 | 0.706 | 9 | 2 | 6 | 1.588 | 1.000 | +0.588 | 27 | 17 | +010 | ||
| 2 | 2004 U11 North* | 16 | 6 | 0.375 | 11 | 3 | 2 | 3.250 | 0.813 | +2.438 | 52 | 13 | +039 | ||
| 256 | 60 | 0.234 | 110 | 36 | 110 | 2.349 | 2.273 | +0.066 | 599 | 582 | +017 |
Umpiring History
Year    Division                      SEN VET JUN
2006    U9 West                                 6
2008    U9 West                                18
2009    U9 West (B)                             1
2009    U11 West                               10
2012    U11 North/West                          1
2012    U13 North/West                          5
2012    U17 North/West                          1
2013    U14 North                              10
2021    Metro B North/West Women        1
2021    Pennant G Men                   2
2021    Vic League 3 Men                1
2022    Vic League 2 Women              2
2022    Pennant E North/West Men        3
2023    U14 Shield B Girls                      2
2023    U14 North/West                          1
2023    U18 North/West                          1
2023    Masters 45+ North/West              5
2023    Metro 1 North/West Women        2
2023    Vic League 2 Women              1
2023    Metro 2 North/West Men          3
2023    Pennant E North/West Men        2
2023    Vic League 3 Men                2
2024    Masters 45+ North/West              1
2024    Metro 1 North/West Women        1

SUBTOTAL                               20   6  56
TOTAL                                          82
Junior Winter Playing History
| Games as Player |
Games Won | Games Drawn | Games Lost | Total | Goals | Goalscoring Average |
|---|---|---|---|---|---|---|
| Junior Winter | 63 | 20 | 52 | 135 | 42 | 0.318 |
| First Game : | Melton 0 drew Footscray (B) 0. R-02: 2004 U11 North |
| Last Game : | PEGS 8 def. Melton 0. GF: 2011 U17 West |
| Best Win : | Melton 11 def. Footscray (B) 0. R-11: 2004 U11 North |
| Worst Loss : | Geelong (1) 12 def. Melton 0. R-02: 2009 U15 West |
| 1 goal games : | 23 times. Last : Melton 9 def. Werribee 0. R-17: 2011 U17 West |
| 2 goal games : | 8 times. Last : Melton 7 def. Werribee 0. R-18: 2010 U17 West |
| 3 goal games : | 1 times. Last : Melton 5 def. Doncaster 0. R-16: 2005 U11 Pennant North |
| Finals : | Greensborough 2 def. Melton 1. GF: 2004 U11 North Melton 2 def. Werribee 0. SF: 2004 U11 North MUHC 1 def. Melton 0. SF: 2005 U11 Pennant North St.Bernards 3 def. Melton 1. GF: 2007 U13 Pennant North Melton 2 def. Essendon 1. SF: 2007 U13 Pennant North St.Bernards (1) 3 def. Melton 3. SF: 2009 U15 West Melton 5 def. Brunswick 0. GF: 2010 U17 West Melton 5 def. PEGS 0. SF: 2010 U17 West PEGS 8 def. Melton 0. GF: 2011 U17 West Melton 3 def. Footscray 0. SF: 2011 U17 West |
| Premierships : | Melton 5 def. Brunswick 0. GF: 2010 U17 West |
Junior Summer Playing History
| Games as Player |
Games Won | Games Drawn | Games Lost | Total | Goals | Goalscoring Average |
|---|---|---|---|---|---|---|
| Junior Summer | 0 | 0 | 1 | 1 | 0 | 0.000 |
| First Game : | MUHC 4 def. Melton 0. R-03: 2008/09 SHC-2 Under 15 |
| Last Game : | MUHC 4 def. Melton 0. R-03: 2008/09 SHC-2 Under 15 |
| Worst Loss : | MUHC 4 def. Melton 0. R-03: 2008/09 SHC-2 Under 15 |
| Finals : | None. |
| Premierships : | None. |
Senior Winter Playing History
| Games as Player |
Games Won | Games Drawn | Games Lost | Total | Goals | Goalscoring Average |
|---|---|---|---|---|---|---|
| Senior Winter | 47 | 16 | 57 | 120 | 18 | 0.153 |
| First Game : | Melton 4 def. Old Melburnians 1. R-10: 2008 Metro 3 West Men |
| Last Game : | Melton 3 def. Caroline Springs 0. R-01: 2024 Metro 1 North/West Men |
| Best Win : | Melton 8 def. PEGS 1. R-09: 2023 Pennant E North/West Men |
| Worst Loss : | RMIT 9 def. Melton 0. R-04: 2018 Pennant G Men |
| 1 goal games : | 13 times. Last : Altona 6 def. Melton 5. R-11: 2023 Metro 2 North/West Men |
| 2 goal games : | 1 times. Last : Melton 5 def. Powerhouse 1. R-03: 2014 Metro 3 West Men |
| 3 goal games : | 1 times. Last : Melton 7 def. RMIT 1. R-18: 2014 Vic League 3 Res. Men |
| Finals : | Melton 6 def. Bayside 1. EF: 2014 Vic League 3 Res. Men Old Melburnians 1 def. Melton 1. PF: 2014 Vic League 3 Res. Men Swinburne 3 def. Melton 1. EF: 2017 Vic League 3 Res. Men |
| Premierships : | None. |
Teammates
Number of teammates :159
| Player |
Games |
Win % | Draw % | Loss % | Unkn % | Avge. Points |
Avge. For | Avge. Aga | Avge. Diff. |
|---|---|---|---|---|---|---|---|---|---|
| McMurrie, Tom* | 137 | 42% | 15% | 42% | 1.423 | 2.263 | 2.285 | -0.022 | |
| Kelly, Bo* | 133 | 43% | 16% | 41% | 1.444 | 2.195 | 2.316 | -0.120 | |
| Strebs-Stelps, Ben* | 118 | 48% | 14% | 38% | 1.585 | 2.432 | 2.085 | +0.347 | |
| Hooley, Aidan* | 114 | 41% | 15% | 44% | 1.386 | 2.009 | 2.281 | -0.272 | |
| Vallance, Liam* | 109 | 41% | 14% | 45% | 1.376 | 1.991 | 2.248 | -0.257 | |
| Scalzo, Mark* | 100 | 44% | 14% | 42% | 1.460 | 2.240 | 2.360 | -0.120 | |
| Jackson, Taylor* | 85 | 38% | 13% | 49% | 1.259 | 1.812 | 2.412 | -0.600 | |
| Knipe, Jessica* | 82 | 44% | 15% | 41% | 1.463 | 2.061 | 2.134 | -0.073 | |
| Oataway, Anthony* | 80 | 38% | 15% | 48% | 1.275 | 1.775 | 2.250 | -0.475 | |
| VellaVanKassel, Chris* | 78 | 29% | 8% | 63% | 0.962 | 1.872 | 3.064 | -1.192 | |
| Kasprzak, Kathryn* | 69 | 46% | 14% | 39% | 1.536 | 2.087 | 1.913 | +0.174 | |
| Lawrence, Jesse* | 68 | 50% | 12% | 38% | 1.618 | 2.853 | 2.103 | +0.750 | |
| Goss, Matthew* | 62 | 29% | 13% | 58% | 1.000 | 1.452 | 2.677 | -1.226 | |
| Kovarik, John* | 54 | 56% | 13% | 31% | 1.796 | 2.667 | 1.630 | +1.037 | |
| Self, Ryan* | 49 | 49% | 10% | 41% | 1.571 | 3.041 | 2.184 | +0.857 | |
| McMurrie, Michael* | 48 | 52% | 19% | 29% | 1.750 | 2.938 | 1.646 | +1.292 | |
| Bluschke, Glen* | 47 | 51% | 13% | 36% | 1.660 | 2.447 | 1.702 | +0.745 | |
| Hanley-Wood, Ben* | 46 | 28% | 15% | 57% | 1.000 | 2.370 | 3.239 | -0.870 | |
| Gati, Andrew* | 44 | 57% | 11% | 32% | 1.818 | 2.318 | 1.455 | +0.864 | |
| Vallance, Lachlan* | 43 | 53% | 16% | 30% | 1.767 | 2.977 | 1.837 | +1.140 | |
| Grant-Taylor, Lexi* | 41 | 46% | 15% | 39% | 1.537 | 2.244 | 2.268 | -0.024 | |
| McLaren, Scott* | 38 | 37% | 18% | 45% | 1.289 | 2.737 | 2.184 | +0.553 | |
| Salvatore, Joel* | 36 | 31% | 14% | 56% | 1.056 | 2.389 | 2.806 | -0.417 | |
| Corless, Sheridan* | 33 | 61% | 15% | 24% | 1.970 | 2.394 | 0.909 | +1.485 | |
| Hardy, Jasmin* | 32 | 34% | 9% | 56% | 1.125 | 1.469 | 2.031 | -0.563 | |
| Jaros, Noah* | 31 | 29% | 13% | 58% | 1.000 | 1.581 | 3.194 | -1.613 | |
| Morcos, Daniel* | 30 | 57% | 20% | 23% | 1.900 | 2.633 | 1.633 | +1.000 | |
| Simpson, Matthew* | 30 | 40% | 10% | 50% | 1.300 | 2.700 | 2.800 | -0.100 | |
| Eastwell, Josh* | 30 | 53% | 10% | 37% | 1.700 | 2.767 | 2.300 | +0.467 | |
| Azzopardi, Justin* | 30 | 33% | 13% | 53% | 1.133 | 2.433 | 2.933 | -0.500 | |
| Lawrence, Hayden* | 29 | 45% | 3% | 52% | 1.379 | 3.241 | 2.483 | +0.759 | |
| Lawrence, Riley* | 29 | 48% | 7% | 45% | 1.517 | 3.241 | 2.690 | +0.552 | |
| Knipe, Lucas* | 27 | 37% | 22% | 41% | 1.333 | 2.185 | 2.259 | -0.074 | |
| Currie, Fraser* | 27 | 44% | 7% | 48% | 1.407 | 3.296 | 2.519 | +0.778 | |
| Lawrence, Stephen* | 25 | 60% | 4% | 36% | 1.840 | 3.600 | 2.400 | +1.200 | |
| Clough, Jarryd* | 25 | 52% | 16% | 32% | 1.720 | 2.840 | 1.840 | +1.000 | |
| Holahan, Zac* | 24 | 54% | 13% | 33% | 1.750 | 3.167 | 1.667 | +1.500 | |
| Strobel, Joshua* | 23 | 43% | 4% | 52% | 1.348 | 2.565 | 2.652 | -0.087 | |
| McMillan, Brent* | 23 | 57% | 13% | 30% | 1.826 | 2.913 | 1.565 | +1.348 | |
| James, William* | 22 | 41% | 23% | 36% | 1.455 | 2.455 | 2.455 | +0.000 | |
| Bentley, Myles* | 21 | 33% | 10% | 57% | 1.095 | 2.333 | 2.952 | -0.619 | |
| May, Adrian* | 20 | 50% | 5% | 45% | 1.550 | 2.650 | 2.450 | +0.200 | |
| James, Daniel* | 20 | 30% | 15% | 55% | 1.050 | 2.000 | 2.950 | -0.950 | |
| Bairstow, Michael* | 19 | 37% | 21% | 42% | 1.316 | 2.842 | 2.263 | +0.579 | |
| Carpenter, Dale* | 18 | 17% | 11% | 72% | 0.611 | 1.278 | 2.778 | -1.500 | |
| Arnold, Chris* | 18 | 50% | 17% | 33% | 1.667 | 2.667 | 2.167 | +0.500 | |
| Brown, Daniel* | 18 | 17% | 17% | 67% | 0.667 | 1.833 | 2.556 | -0.722 | |
| Vallance, Hayley* | 17 | 18% | 6% | 76% | 0.588 | 1.235 | 2.824 | -1.588 | |
| Mumford, Matthew* | 17 | 41% | 18% | 41% | 1.412 | 2.353 | 2.000 | +0.353 | |
| Arnold, David* | 17 | 41% | 18% | 41% | 1.412 | 2.471 | 2.412 | +0.059 | |
| Hobbs, Brad* | 17 | 47% | 18% | 35% | 1.588 | 2.471 | 2.294 | +0.176 | |
| Docherty, Benjamin* | 17 | 53% | 12% | 35% | 1.706 | 2.471 | 2.235 | +0.235 | |
| Woof, Thomas | 17 | 59% | 6% | 35% | 1.824 | 2.824 | 2.176 | +0.647 | |
| Baker, Daniel* | 17 | 35% | 24% | 41% | 1.294 | 2.235 | 2.294 | -0.059 | |
| Knight, Jason* | 17 | 41% | 18% | 41% | 1.412 | 2.647 | 2.529 | +0.118 | |
| Corless, Melanie* | 16 | 69% | 19% | 13% | 2.250 | 3.250 | 0.813 | +2.438 | |
| Feben, Billy* | 16 | 56% | 13% | 31% | 1.813 | 1.688 | 0.938 | +0.750 | |
| Arnold, Andrew* | 16 | 44% | 19% | 38% | 1.500 | 3.063 | 2.375 | +0.688 | |
| Brazil, Sean* | 16 | 44% | 19% | 38% | 1.500 | 2.250 | 2.063 | +0.188 | |
| MacKenzie, Darren* | 16 | 44% | 6% | 50% | 1.375 | 3.563 | 2.813 | +0.750 | |
| Kelly, Lee* | 15 | 53% | 47% | 1.600 | 2.600 | 2.400 | +0.200 | ||
| Lawrence, Geoffrey* | 15 | 47% | 27% | 27% | 1.667 | 2.667 | 2.333 | +0.333 | |
| Lawrence, Richard* | 15 | 60% | 13% | 27% | 1.933 | 3.200 | 2.133 | +1.067 | |
| Sinclair, Michaella* | 14 | 64% | 21% | 14% | 2.143 | 3.000 | 0.786 | +2.214 | |
| Mendez, Samuel* | 14 | 57% | 7% | 36% | 1.786 | 1.714 | 1.000 | +0.714 | |
| Hardy, Madeline* | 14 | 14% | 14% | 71% | 0.571 | 1.286 | 2.929 | -1.643 | |
| Shelly-Robbins, James* | 14 | 57% | 21% | 21% | 1.929 | 2.571 | 0.929 | +1.643 | |
| Caiafa, Jackson* | 14 | 50% | 7% | 43% | 1.571 | 2.786 | 2.500 | +0.286 | |
| Kasprzak, Marcus* | 13 | 54% | 23% | 23% | 1.846 | 2.462 | 1.462 | +1.000 | |
| Lawrence, Tony* | 13 | 46% | 8% | 46% | 1.462 | 2.846 | 3.077 | -0.231 | |
| McKinnon, Dale* | 12 | 67% | 17% | 17% | 2.167 | 3.167 | 0.917 | +2.250 | |
| Noonan, Kristian* | 12 | 33% | 25% | 42% | 1.250 | 2.000 | 2.417 | -0.417 | |
| Slocombe, Morgan* | 12 | 25% | 25% | 50% | 1.000 | 2.000 | 3.000 | -1.000 | |
| Lawrence, Tejay* | 12 | 42% | 8% | 50% | 1.333 | 3.500 | 3.083 | +0.417 | |
| James, Jeff* | 12 | 8% | 8% | 83% | 0.333 | 1.500 | 2.583 | -1.083 | |
| Shadbolt, Megan* | 11 | 64% | 18% | 18% | 2.091 | 2.909 | 1.000 | +1.909 | |
| Hosking, Michael* | 11 | 36% | 9% | 55% | 1.182 | 2.455 | 2.909 | -0.455 | |
| Knight, Tristan* | 11 | 36% | 18% | 45% | 1.273 | 2.364 | 2.636 | -0.273 | |
| Armitage, Callan* | 11 | 45% | 55% | 1.364 | 3.091 | 3.000 | +0.091 | ||
| Lawrence, Brody* | 11 | 73% | 9% | 18% | 2.273 | 3.545 | 1.727 | +1.818 | |
| Morris, Sebastian* | 11 | 36% | 18% | 45% | 1.273 | 2.455 | 2.636 | -0.182 | |
| Hays, Jenna* | 10 | 50% | 10% | 40% | 1.600 | 1.600 | 1.200 | +0.400 | |
| Hooley, Ryan* | 10 | 50% | 30% | 20% | 1.800 | 3.000 | 2.000 | +1.000 | |
| VellaVanKassel, Nick* | 10 | 50% | 50% | 1.500 | 2.600 | 2.600 | +0.000 | ||
| Armitage, Timothy* | 10 | 20% | 20% | 60% | 0.800 | 1.800 | 3.800 | -2.000 | |
| Haddy, Thomas* | 10 | 20% | 80% | 0.200 | 1.600 | 3.100 | -1.500 | ||
| Fleming, Ashleigh* | 9 | 11% | 11% | 78% | 0.444 | 0.556 | 4.333 | -3.778 | |
| Murphy, Mathew* | 9 | 44% | 56% | 1.333 | 2.333 | 2.222 | +0.111 | ||
| Bonnici, Brad* | 9 | 11% | 22% | 67% | 0.556 | 1.667 | 2.333 | -0.667 | |
| Brown, Chris* | 9 | 11% | 11% | 78% | 0.444 | 1.667 | 3.333 | -1.667 | |
| Closter, Seth* | 9 | 56% | 11% | 33% | 1.778 | 3.111 | 2.333 | +0.778 | |
| Shadbolt, Ron* | 8 | 50% | 25% | 25% | 1.750 | 2.500 | 2.750 | -0.250 | |
| Kovarik, Hans* | 8 | 38% | 25% | 38% | 1.375 | 2.625 | 3.125 | -0.500 | |
| Crebbin, Jason* | 8 | 25% | 25% | 50% | 1.000 | 2.375 | 2.750 | -0.375 | |
| Micallef, Levi* | 8 | 63% | 13% | 25% | 2.000 | 2.875 | 1.625 | +1.250 | |
| Micallef, Reuben* | 8 | 63% | 13% | 25% | 2.000 | 2.875 | 1.625 | +1.250 | |
| Haddy, Stephen* | 8 | 100% | 0.000 | 1.375 | 3.625 | -2.250 | |||
| Bonnici, Samuel* | 8 | 38% | 25% | 38% | 1.375 | 2.625 | 2.250 | +0.375 | |
| Strebs-Stelps, Leo* | 7 | 43% | 29% | 29% | 1.571 | 2.857 | 3.286 | -0.429 | |
| Lawrence, Darcy* | 7 | 14% | 14% | 71% | 0.571 | 2.000 | 4.714 | -2.714 | |
| Ferguson, Jack* | 7 | 14% | 86% | 0.143 | 1.714 | 3.143 | -1.429 | ||
| Cook, Stuart* | 6 | 17% | 83% | 0.500 | 0.833 | 3.833 | -3.000 | ||
| Murphy, Craig* | 6 | 17% | 83% | 0.500 | 0.500 | 3.667 | -3.167 | ||
| Gorton, David* | 6 | 67% | 17% | 17% | 2.167 | 2.500 | 0.833 | +1.667 | |
| Gregorio, Callum* | 6 | 33% | 17% | 50% | 1.167 | 2.000 | 1.333 | +0.667 | |
| Dine, Brenton* | 5 | 20% | 80% | 0.600 | 0.800 | 4.000 | -3.200 | ||
| Stanyer, Adrian* | 5 | 20% | 60% | 20% | 1.200 | 1.600 | 1.600 | +0.000 | |
| Gati, Nick* | 5 | 60% | 40% | 1.800 | 2.600 | 2.200 | +0.400 | ||
| Griffiths, Rylee* | 5 | 80% | 20% | 2.400 | 3.600 | 2.400 | +1.200 | ||
| Buttigieg, William* | 5 | 20% | 20% | 60% | 0.800 | 1.600 | 2.600 | -1.000 | |
| Blackwell, Grahame* | 5 | 20% | 20% | 60% | 0.800 | 1.200 | 1.400 | -0.200 | |
| Otter, Eddie* | 5 | 20% | 80% | 0.200 | 1.000 | 2.800 | -1.800 | ||
| McKenzie, Lachlan | 5 | 40% | 20% | 40% | 1.400 | 2.800 | 2.800 | +0.000 | |
| Anderson, Matthew* | 4 | 25% | 75% | 0.750 | 1.000 | 4.500 | -3.500 | ||
| Hobbs, Neil* | 4 | 25% | 75% | 0.750 | 1.000 | 4.000 | -3.000 | ||
| McMurrie, Andrew* | 4 | 25% | 75% | 0.750 | 1.000 | 4.000 | -3.000 | ||
| Bell, Ray* | 4 | 25% | 75% | 0.250 | 0.500 | 4.000 | -3.500 | ||
| Court, Andrew | 4 | 100% | 0.000 | 0.000 | 4.750 | -4.750 | |||
| Corban, Malcolm* | 4 | 25% | 50% | 25% | 1.250 | 2.250 | 3.750 | -1.500 | |
| Meehan, James* | 4 | 50% | 25% | 25% | 1.750 | 3.250 | 2.250 | +1.000 | |
| Patterson, Dylan | 4 | 50% | 25% | 25% | 1.750 | 3.250 | 2.250 | +1.000 | |
| Burgan, Deeon | 4 | 25% | 25% | 50% | 1.000 | 1.750 | 1.750 | +0.000 | |
| Kouroumalos, Deon* | 4 | 100% | 0.000 | 1.500 | 3.500 | -2.000 | |||
| Haycock, John* | 3 | 33% | 67% | 1.000 | 1.667 | 2.333 | -0.667 | ||
| Sorensen, Steven* | 3 | 67% | 33% | 2.333 | 2.000 | 0.667 | +1.333 | ||
| Nurse, Cameron* | 3 | 33% | 67% | 1.000 | 2.667 | 3.000 | -0.333 | ||
| Taylor, Harvey* | 3 | 100% | 0.000 | 0.667 | 2.667 | -2.000 | |||
| MacKenzie, Lachlan* | 3 | 67% | 33% | 2.333 | 2.000 | 0.667 | +1.333 | ||
| Hoad, Simon* | 2 | 100% | 0.000 | 0.000 | 6.500 | -6.500 | |||
| Downs, Andrew* | 2 | 100% | 3.000 | 3.000 | 1.000 | +2.000 | |||
| Lawrence, Glenn* | 2 | 100% | 3.000 | 3.000 | 1.000 | +2.000 | |||
| Chisholm, Jack* | 2 | 50% | 50% | 1.500 | 1.500 | 4.000 | -2.500 | ||
| Phillips, Chad* | 2 | 50% | 50% | 1.500 | 1.500 | 4.000 | -2.500 | ||
| Baxter, Peter* | 2 | 50% | 50% | 1.500 | 3.000 | 3.500 | -0.500 | ||
| Rodrigues, Errol* | 2 | 50% | 50% | 1.500 | 4.000 | 3.000 | +1.000 | ||
| Caiafa, Sebastian* | 2 | 50% | 50% | 1.500 | 4.000 | 3.000 | +1.000 | ||
| Sutton, Shaun* | 2 | 50% | 50% | 0.500 | 0.500 | 1.500 | -1.000 | ||
| Abraham, Liam* | 2 | 100% | 3.000 | 4.500 | 1.500 | +3.000 | |||
| Wright, Tim* | 2 | 100% | 0.000 | 2.000 | 5.000 | -3.000 | |||
| Deol, Manpreet* | 2 | 100% | 0.000 | 1.500 | 2.500 | -1.000 | |||
| Allen, Mark* | 2 | 50% | 50% | 1.500 | 2.000 | 1.000 | +1.000 | ||
| Walther, Erica* | 2 | 100% | 0.000 | 1.500 | 3.000 | -1.500 | |||
| Davis, Brett* | 2 | 50% | 50% | 2.000 | 2.000 | 0.500 | +1.500 | ||
| Naseer, Rizwan* | 2 | 50% | 50% | 0.500 | 3.000 | 3.500 | -0.500 | ||
| Wilson, Christopher* | 2 | 50% | 50% | 0.500 | 3.000 | 3.500 | -0.500 | ||
| Downs, David* | 1 | 100% | 3.000 | 4.000 | 1.000 | +3.000 | |||
| Matthews, Ben* | 1 | 100% | 0.000 | 2.000 | 10.000 | -8.000 | |||
| Gill, Jack | 1 | 100% | 1.000 | 1.000 | 1.000 | +0.000 | |||
| Hart, Liam* | 1 | 100% | 0.000 | 0.000 | 2.000 | -2.000 | |||
| Spence, Alannah* | 1 | 100% | 3.000 | 5.000 | 2.000 | +3.000 | |||
| Kuchel, Joshua* | 1 | 100% | 3.000 | 5.000 | 1.000 | +4.000 | |||
| Armitage, Rohan* | 1 | 100% | 0.000 | 0.000 | 1.000 | -1.000 | |||
| Williamson, Jordan* | 1 | 100% | 0.000 | 2.000 | 7.000 | -5.000 | |||
| Bird, Tynan* | 1 | 100% | 0.000 | 0.000 | 6.000 | -6.000 | |||
| Brown, Alfie* | 1 | 100% | 3.000 | 4.000 | 1.000 | +3.000 | |||
| Rance, Brendan* | 1 | 100% | 3.000 | 4.000 | 1.000 | +3.000 | |||
| Bonnici, Benjamin* | 1 | 100% | 3.000 | 3.000 | 0.000 | +3.000 | |||
| Holahan, Sebastian* | 1 | 100% | 3.000 | 3.000 | 0.000 | +3.000 | |||
| Simpson, Mitchell* | 1 | 100% | 3.000 | 3.000 | 0.000 | +3.000 |
Opposition Teams
| Opponent |
Games |
Goals | Avge |
Win % | Draw % | Loss % | Unkn % | Avge. Points |
Avge. For | Avge. Aga | Avge. Diff. |
G.K. Games | Shut- outs | Shut- out % | Goals In | Goals Avge |
|---|---|---|---|---|---|---|---|---|---|---|---|---|---|---|---|---|
| Werribee | 23 | 6 | 0.261 | 61% | 9% | 30% | 1.913 | 3.478 | 1.652 | +1.826 | ||||||
| Footscray | 19 | 5 | 0.263 | 32% | 42% | 26% | 1.368 | 2.158 | 1.737 | +0.421 | ||||||
| St.Bernards | 17 | 3 | 0.176 | 29% | 71% | 0.882 | 1.706 | 2.882 | -1.176 | |||||||
| Altona | 15 | 7 | 0.467 | 53% | 7% | 40% | 1.667 | 3.000 | 2.667 | +0.333 | ||||||
| Essendon | 15 | 4 | 0.267 | 53% | 7% | 40% | 1.667 | 2.133 | 2.133 | +0.000 | ||||||
| PEGS | 15 | 27% | 20% | 53% | 1.000 | 2.133 | 3.800 | -1.667 | ||||||||
| Greensborough | 12 | 1 | 0.083 | 25% | 25% | 50% | 1.000 | 1.417 | 2.083 | -0.667 | ||||||
| Brunswick | 11 | 3 | 0.273 | 82% | 18% | 2.455 | 2.091 | 1.273 | +0.818 | |||||||
| Swinburne | 10 | 60% | 30% | 10% | 2.100 | 3.500 | 1.700 | +1.800 | ||||||||
| ECHO | 10 | 1 | 0.100 | 40% | 30% | 30% | 1.500 | 2.100 | 1.500 | +0.600 | ||||||
| Powerhouse | 9 | 5 | 0.556 | 44% | 56% | 1.333 | 2.111 | 2.667 | -0.556 | |||||||
| RMIT | 9 | 3 | 0.333 | 56% | 44% | 1.667 | 2.778 | 3.000 | -0.222 | |||||||
| Collegians-X | 9 | 1 | 0.111 | 67% | 33% | 2.000 | 3.222 | 1.333 | +1.889 | |||||||
| MUHC | 7 | 1 | 0.143 | 14% | 29% | 57% | 0.714 | 0.857 | 1.429 | -0.571 | ||||||
| Old Melburnians | 7 | 43% | 14% | 43% | 1.429 | 2.429 | 2.143 | +0.286 | ||||||||
| Doncaster | 6 | 6 | 1.000 | 50% | 17% | 33% | 1.667 | 2.667 | 1.500 | +1.167 | ||||||
| TEM | 5 | 2 | 0.400 | 80% | 20% | 2.400 | 2.400 | 2.000 | +0.400 | |||||||
| Geelong | 5 | 100% | 0.000 | 0.600 | 5.800 | -5.200 | ||||||||||
| Bayside | 5 | 2 | 0.400 | 60% | 20% | 20% | 2.000 | 3.400 | 1.400 | +2.000 | ||||||
| Camberwell | 4 | 1 | 0.250 | 50% | 50% | 1.500 | 2.000 | 2.500 | -0.500 | |||||||
| Yarra Valley | 4 | 3 | 0.750 | 50% | 25% | 25% | 1.750 | 3.000 | 0.500 | +2.500 | ||||||
| Hawthorn | 4 | 1 | 0.250 | 25% | 25% | 50% | 1.000 | 1.750 | 2.750 | -1.000 | ||||||
| Dandenong | 4 | 100% | 0.000 | 1.500 | 5.250 | -3.750 | ||||||||||
| Croydon | 4 | 25% | 75% | 0.750 | 1.750 | 3.000 | -1.250 | |||||||||
| Old Haileybury | 3 | 67% | 33% | 2.000 | 2.667 | 0.667 | +2.000 | |||||||||
| Hume | 3 | 100% | 0.000 | 2.000 | 3.667 | -1.667 | ||||||||||
| Caroline Springs | 3 | 33% | 67% | 1.667 | 1.667 | 0.667 | +1.000 | |||||||||
| Whittlesea | 3 | 33% | 67% | 0.333 | 1.333 | 3.667 | -2.333 | |||||||||
| Ajax-Maccabi | 2 | 50% | 50% | 2.000 | 2.000 | 0.000 | +2.000 | |||||||||
| St.Bedes | 2 | 1 | 0.500 | 50% | 50% | 0.500 | 1.500 | 4.500 | -3.000 | |||||||
| Maccabi | 2 | 50% | 50% | 1.500 | 3.500 | 1.500 | +2.000 | |||||||||
| Craigieburn | 2 | 1 | 0.500 | 100% | 0.000 | 1.500 | 3.000 | -1.500 | ||||||||
| Latrobe Uni | 2 | 50% | 50% | 1.500 | 1.500 | 3.000 | -1.500 | |||||||||
| Box Hill | 1 | 1 | 1.000 | 100% | 0.000 | 2.000 | 3.000 | -1.000 | ||||||||
| Frankston | 1 | 1 | 1.000 | 100% | 0.000 | 3.000 | 5.000 | -2.000 | ||||||||
| Vic Sihks | 1 | 100% | 0.000 | 1.000 | 3.000 | -2.000 | ||||||||||
| Old Carey | 1 | 1 | 1.000 | 100% | 3.000 | 7.000 | 0.000 | +7.000 | ||||||||
| Old Trinity | 1 | 100% | 3.000 | 4.000 | 2.000 | +2.000 | ||||||||||
| Opponents :38 | 256 | 60 | 0.234 | 43% | 14% | 43% | 1.430 | 2.340 | 2.273 | +0.066 |
Playing Venues
| Venue | Games |
Goals | Avge. |
Win % | Draw % | Loss % | Unkn % | Avge. Points |
Avge. For | Avge. Aga | Avge. Diff. |
G.K. Games | Shut- outs | Shut- out % | Goals In | Goals Avge. |
|---|---|---|---|---|---|---|---|---|---|---|---|---|---|---|---|---|
| Melton Mowbray | 86 | 26 | 0.302 | 49% | 14% | 37% | 1.605 | 2.244 | 1.965 | +0.279 | ||||||
| Melton | 32 | 5 | 0.156 | 41% | 13% | 47% | 1.344 | 2.875 | 2.563 | +0.313 | ||||||
| Footscray | 19 | 5 | 0.263 | 32% | 11% | 58% | 1.053 | 1.947 | 2.737 | -0.789 | ||||||
| Werribee | 13 | 2 | 0.154 | 69% | 8% | 23% | 2.154 | 3.615 | 1.615 | +2.000 | ||||||
| SHC | 12 | 3 | 0.250 | 33% | 17% | 50% | 1.167 | 2.083 | 3.000 | -0.917 | ||||||
| St.Bernards | 8 | 25% | 13% | 63% | 0.875 | 1.750 | 3.500 | -1.750 | ||||||||
| Altona | 7 | 4 | 0.571 | 57% | 14% | 29% | 1.857 | 3.143 | 2.857 | +0.286 | ||||||
| Essendon | 7 | 43% | 29% | 29% | 1.571 | 1.857 | 1.286 | +0.571 | ||||||||
| Hawthorn | 6 | 50% | 17% | 33% | 1.667 | 2.333 | 1.833 | +0.500 | ||||||||
| Brunswick | 6 | 2 | 0.333 | 67% | 33% | 2.000 | 2.167 | 1.833 | +0.333 | |||||||
| PEGS | 6 | 1 | 0.167 | 50% | 50% | 0.500 | 1.167 | 4.167 | -3.000 | |||||||
| Melbourne Uni | 5 | 1 | 0.200 | 20% | 80% | 0.200 | 0.800 | 2.000 | -1.200 | |||||||
| Albert Park | 5 | 1 | 0.200 | 40% | 60% | 1.200 | 2.200 | 2.200 | +0.000 | |||||||
| Monash | 4 | 50% | 50% | 1.500 | 3.500 | 2.000 | +1.500 | |||||||||
| Reservoir | 4 | 2 | 0.500 | 25% | 75% | 1.500 | 2.000 | 1.250 | +0.750 | |||||||
| Bundoora | 4 | 50% | 50% | 1.500 | 2.250 | 3.000 | -0.750 | |||||||||
| Greensborough | 3 | 33% | 67% | 1.000 | 0.667 | 2.667 | -2.000 | |||||||||
| Melb Grammar | 3 | 67% | 33% | 2.000 | 3.333 | 3.000 | +0.333 | |||||||||
| Waverley | 3 | 1 | 0.333 | 33% | 67% | 0.333 | 1.667 | 2.667 | -1.000 | |||||||
| Camberwell | 2 | 1 | 0.500 | 50% | 50% | 1.500 | 2.000 | 3.000 | -1.000 | |||||||
| Doncaster | 2 | 2 | 1.000 | 100% | 3.000 | 3.000 | 0.500 | +2.500 | ||||||||
| Yarra Valley | 2 | 1 | 0.500 | 100% | 3.000 | 5.500 | 1.500 | +4.000 | ||||||||
| Geelong | 2 | 100% | 0.000 | 0.500 | 4.000 | -3.500 | ||||||||||
| Not Recorded | 2 | 50% | 50% | 1.500 | 3.000 | 0.500 | +2.500 | |||||||||
| Brighton | 2 | 1 | 0.500 | 50% | 50% | 1.500 | 3.000 | 1.000 | +2.000 | |||||||
| Koonung | 2 | 50% | 50% | 0.500 | 0.000 | 1.000 | -1.000 | |||||||||
| Dandenong | 2 | 100% | 0.000 | 1.000 | 3.500 | -2.500 | ||||||||||
| PSF | 2 | 50% | 50% | 2.000 | 4.000 | 2.000 | +2.000 | |||||||||
| Hume | 2 | 100% | 0.000 | 1.500 | 3.500 | -2.000 | ||||||||||
| Haileybury | 1 | 100% | 3.000 | 3.000 | 0.000 | +3.000 | ||||||||||
| Melbourne High | 1 | 1 | 1.000 | 100% | 3.000 | 6.000 | 1.000 | +5.000 | ||||||||
| Frankston | 1 | 1 | 1.000 | 100% | 0.000 | 3.000 | 5.000 | -2.000 | ||||||||
| Venues :32 | 256 | 60 | 0.234 | 43% | 14% | 43% | 1.430 | 2.340 | 2.273 | +0.066 |