 |
Melton Hockey Club |
|
Last updated : 9:38 am - 2 November 2023

Club Cap : 581
(Games : 211, Goals : 2 )
First XI Vet's Cap : 29
(Games : 100, Goals : 0)
Milestones
| 2004-Jan-12 : | First game (Melton 5 def. Footscray (A) 1. R-07: 2003/04 Footscray Veterans) |
| 2004-Nov-08 : | First goal scored (Melton 6 def. MCC (B) 0. R-01: 2004/05 Melb High Veterans) |
| 2012-Jun-30 : | First Senior game (St.Bernards 4 def. Melton 0. R-11: 2012 Metro 3 West Men) |
| 2023-Apr-15 : | Last Senior game (Essendon 3 def. Melton 0. R-01: 2023 Metro 2 North/West Men) |
| 2023-Aug-28 : | Last game played (Footscray 2 def. Melton 0. R-16: 2023 Masters 45+ NW) |
| Playing career : 7168 days. (19 years and 233 days.) |
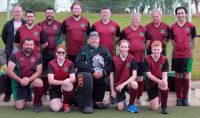
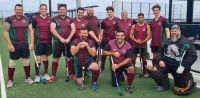
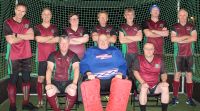
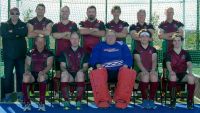
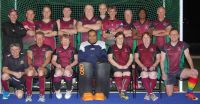
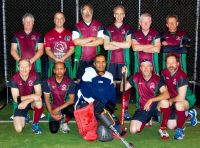
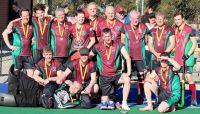
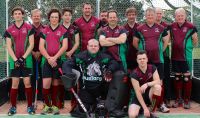
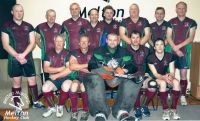
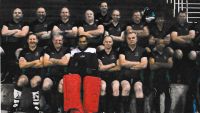
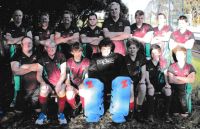
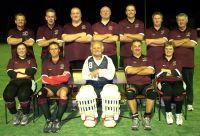
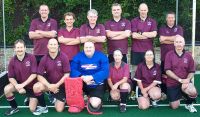
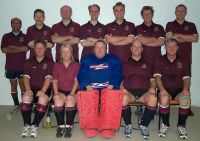
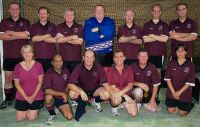
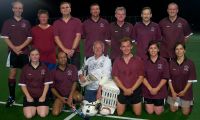
Team Photographs


Complete Playing History
Teams played with : 25
Premierships won : 0
Wooden Spoons : 1
| Games as Player |
Games Won | Games Drawn | Games Lost | Total | Goals | Goalscoring Average |
|---|---|---|---|---|---|---|
| Senior Winter | 17 | 5 | 34 | 56 | 0 | 0.000 |
| Veteran Winter | 41 | 22 | 62 | 125 | 0 | 0.000 |
| Veteran Summer | 18 | 2 | 10 | 30 | 2 | 0.067 |
| Veteran Total | 59 | 24 | 72 | 155 | 2 | 0.013 |
| Total | 76 | 29 | 106 | 211 | 2 | 0.010 |
| Pos. | PR/WS | Div. | Competition | Games | Goals | Avge. | Won | Drawn | Lost | Avge.For | Avge.Aga | Avge.Diff | G.For | G.Aga | GoalDiff |
|---|---|---|---|---|---|---|---|---|---|---|---|---|---|---|---|
| 7 | 2023 Metro 2 North/West Men* | 1 | 1 | 0.000 | 3.000 | -3.000 | 0 | 3 | -003 | ||||||
| 6 | 2023 Masters 45+ NW* | 9 | 3 | 6 | 1.889 | 1.889 | +0.000 | 17 | 17 | +000 | |||||
| 9 | 2022 Metro 2 North/West Men* | 12 | 3 | 1 | 8 | 2.000 | 2.583 | -0.583 | 24 | 31 | -007 | ||||
| 6 | 2021 Metro B North/West Men* | 7 | 2 | 5 | 1.571 | 1.857 | -0.286 | 11 | 13 | -002 | |||||
| 5 | 2021 Masters 45+ Central North West* | 9 | 3 | 1 | 5 | 1.222 | 2.000 | -0.778 | 11 | 18 | -007 | ||||
| 10 | WS | 2019 Metro B North/West Men* | 7 | 1 | 1 | 5 | 1.429 | 3.857 | -2.429 | 10 | 27 | -017 | |||
| 7 | 2019 Masters 45+ C Central North* | 14 | 3 | 3 | 8 | 1.929 | 2.500 | -0.571 | 27 | 35 | -008 | ||||
| 5 | 2018 Masters 45+ C Central North* | 1 | 1 | 2.000 | 1.000 | +1.000 | 2 | 1 | +001 | ||||||
| 6 | 2017 Metro B North/West Men* | 12 | 3 | 2 | 7 | 1.833 | 3.333 | -1.500 | 22 | 40 | -018 | ||||
| 8 | 2017 Masters 45+ C Central/North* | 14 | 3 | 3 | 8 | 1.357 | 1.357 | +0.000 | 19 | 19 | +000 | ||||
| 7 | 2016 Masters 45+ B North/West* | 7 | 1 | 1 | 5 | 1.000 | 3.571 | -2.571 | 7 | 25 | -018 | ||||
| 2 | 2015 Metro B North/West Men* | 10 | 8 | 2 | 3.400 | 1.700 | +1.700 | 34 | 17 | +017 | |||||
| 5 | 2013 Metro 3 West (B)* | 5 | 1 | 4 | 0.800 | 5.600 | -4.800 | 4 | 28 | -024 | |||||
| 3 | 2012/13 Footscray Summer Vets | 5 | 2 | 3 | 1.800 | 3.000 | -1.200 | 9 | 15 | -006 | |||||
| 9 | 2012 Metro 3 West Men* | 2 | 2 | 2.500 | 6.000 | -3.500 | 5 | 12 | -007 | ||||||
| 7 | 2012 Veterans C West* | 13 | 5 | 1 | 7 | 1.077 | 2.385 | -1.308 | 14 | 31 | -017 | ||||
| 6 | 2008 Veterans C West* | 1 | 1 | 3.000 | 0.000 | +3.000 | 3 | 0 | +003 | ||||||
| 8 | 2008 Veterans D West* | 8 | 1 | 7 | 1.250 | 3.500 | -2.250 | 10 | 28 | -018 | |||||
| 7 | 2007 Veterans C West* | 1 | 1 | 0.000 | 0.000 | +0.000 | 0 | 0 | +000 | ||||||
| 3 | 2007 Veterans E* | 17 | 9 | 4 | 4 | 2.471 | 0.882 | +1.588 | 42 | 15 | +027 | ||||
| 8 | 2006 Veterans C West* | 12 | 2 | 3 | 7 | 1.417 | 2.417 | -1.000 | 17 | 29 | -012 | ||||
| 2 | 2005/06 Melb Uni/High Veterans* | 11 | 8 | 3 | 2.727 | 1.909 | +0.818 | 30 | 21 | +009 | |||||
| 3 | 2005 Veterans C West* | 19 | 10 | 4 | 5 | 1.789 | 1.158 | +0.632 | 34 | 22 | +012 | ||||
| 3 | 2004/05 Melb High Veterans* | 10 | 2 | 0.200 | 6 | 2 | 2 | 3.100 | 1.100 | +2.000 | 31 | 11 | +020 | ||
| 5 | 2003/04 Footscray Veterans* | 4 | 2 | 2 | 2.250 | 2.250 | +0.000 | 9 | 9 | +000 | |||||
| 211 | 2 | 0.009 | 76 | 29 | 106 | 1.941 | 2.213 | -0.355 | 392 | 467 | -075 |
Senior Winter Playing History
| Games as Player |
Games Won | Games Drawn | Games Lost | Total | Goals | Goalscoring Average |
|---|---|---|---|---|---|---|
| Senior Winter | 17 | 5 | 34 | 56 | 0 | 0.000 |
| First Game : | St.Bernards 4 def. Melton 0. R-11: 2012 Metro 3 West Men |
| Last Game : | Essendon 3 def. Melton 0. R-01: 2023 Metro 2 North/West Men |
| Best Win : | Melton 6 def. PEGS 0. R-10: 2015 Metro B North/West Men |
| Worst Loss : | Werribee (B) 9 def. Melton 0. R-12: 2013 Metro 3 West (B) |
| Finals : | Footscray (R) 4 def. Melton 1. GF: 2015 Metro B North/West Men Melton 4 def. PEGS 2. QF: 2015 Metro B North/West Men |
| Premierships : | None. |
Veteran Winter Playing History
| Games as Player |
Games Won | Games Drawn | Games Lost | Total | Goals | Goalscoring Average |
|---|---|---|---|---|---|---|
| Veteran Winter | 41 | 22 | 62 | 125 | 0 | 0.000 |
| First Game : | Melton 3 def. Ajax-Maccabi 2. R-01: 2005 Veterans C West |
| Last Game : | Footscray 2 def. Melton 0. R-16: 2023 Masters 45+ NW |
| Best Win : | Melton 9 def. Latrobe Uni 0. R-03: 2017 Masters 45+ C Central/North |
| Worst Loss : | Latrobe Uni 9 def. Melton 0. R-17: 2019 Masters 45+ C Central North |
| Finals : | Powerhouse 2 def. Melton 0. PF: 2005 Veterans C West Melton 1 def. Geelong 1. SF: 2005 Veterans C West Box Hill 2 def. Melton 1. PF: 2007 Veterans E Hawthorn 2 def. Melton 0. SF: 2007 Veterans E |
| Premierships : | None. |
Veteran Summer Playing History
| Games as Player |
Games Won | Games Drawn | Games Lost | Total | Goals | Goalscoring Average |
|---|---|---|---|---|---|---|
| Veteran Summer | 18 | 2 | 10 | 30 | 2 | 0.067 |
| First Game : | Melton 5 def. Footscray (A) 1. R-07: 2003/04 Footscray Veterans |
| Last Game : | Melton 1 def. Geelong 0. R-07: 2012/13 Footscray Summer Vets |
| Best Win : | Melton 9 def. MCC (B) 0. R-08: 2004/05 Melb High Veterans |
| Worst Loss : | Geelong 6 def. Melton 1. R-02: 2012/13 Footscray Summer Vets |
| 2 goal games : | 1 times. Last : Melton 6 def. MCC (B) 0. R-01: 2004/05 Melb High Veterans |
| Finals : | Melton 2 def. Elwood 0. CF: 2004/05 Melb High Veterans Collegians-X 1 def. Melton 0. SF: 2004/05 Melb High Veterans Collegians-X 5 def. Melton 3. GF: 2005/06 Melb Uni/High Veterans Melton 3 def. MCC 2. SF: 2005/06 Melb Uni/High Veterans |
| Premierships : | None. |
Teammates
Number of teammates :146
| Player |
Games |
Win % | Draw % | Loss % | Unkn % | Avge. Points |
Avge. For | Avge. Aga | Avge. Diff. |
|---|---|---|---|---|---|---|---|---|---|
| Cook, Stuart* | 145 | 37% | 18% | 46% | 1.276 | 1.841 | 2.014 | -0.172 | |
| Strebs-Stelps, Leo* | 110 | 29% | 15% | 56% | 1.018 | 1.718 | 2.609 | -0.891 | |
| Arnold, David* | 96 | 26% | 15% | 59% | 0.927 | 1.625 | 2.406 | -0.781 | |
| McLaren, Scott* | 90 | 40% | 13% | 47% | 1.333 | 2.022 | 2.022 | +0.000 | |
| Shadbolt, Ron* | 84 | 46% | 15% | 38% | 1.548 | 2.048 | 2.024 | +0.024 | |
| Kovarik, Hans* | 83 | 46% | 14% | 40% | 1.518 | 1.952 | 2.096 | -0.145 | |
| Downs, David* | 79 | 43% | 20% | 37% | 1.494 | 2.025 | 1.734 | +0.291 | |
| Bluschke, Alf* | 68 | 49% | 15% | 37% | 1.603 | 1.912 | 1.809 | +0.103 | |
| Falcao, Hip* | 67 | 45% | 13% | 42% | 1.478 | 1.746 | 1.896 | -0.149 | |
| Grant-Taylor, Sandy* | 65 | 40% | 17% | 43% | 1.369 | 1.892 | 1.969 | -0.077 | |
| Rodrigues, Errol* | 62 | 32% | 15% | 53% | 1.113 | 1.452 | 1.968 | -0.516 | |
| Hosking, Robert* | 54 | 39% | 15% | 46% | 1.315 | 1.741 | 2.056 | -0.315 | |
| Armitage, Rohan* | 52 | 21% | 13% | 65% | 0.769 | 1.385 | 2.731 | -1.346 | |
| Fleming, Linda* | 51 | 47% | 20% | 33% | 1.608 | 2.000 | 1.647 | +0.353 | |
| Brown, Chris* | 40 | 30% | 8% | 63% | 0.975 | 1.825 | 2.225 | -0.400 | |
| Hart, Jack* | 38 | 26% | 11% | 63% | 0.895 | 1.711 | 2.026 | -0.316 | |
| Simpson, Matthew* | 37 | 35% | 5% | 59% | 1.108 | 2.054 | 2.622 | -0.568 | |
| Downs, Colleen* | 36 | 44% | 17% | 39% | 1.500 | 2.083 | 1.722 | +0.361 | |
| Baker, Gavin* | 34 | 47% | 15% | 38% | 1.559 | 2.441 | 1.882 | +0.559 | |
| Graetz, Jeff* | 33 | 55% | 18% | 27% | 1.818 | 2.333 | 1.273 | +1.061 | |
| Cautley, Mark* | 32 | 59% | 16% | 25% | 1.938 | 2.563 | 1.344 | +1.219 | |
| Corban, Malcolm* | 32 | 47% | 6% | 47% | 1.469 | 1.875 | 2.594 | -0.719 | |
| Brown, Daniel* | 29 | 28% | 7% | 66% | 0.897 | 1.586 | 2.241 | -0.655 | |
| Lawrence, William* | 26 | 38% | 15% | 46% | 1.308 | 2.231 | 1.885 | +0.346 | |
| Baxter, Peter* | 26 | 35% | 19% | 46% | 1.231 | 1.885 | 1.692 | +0.192 | |
| Williams, Lesley* | 21 | 57% | 19% | 24% | 1.905 | 2.000 | 1.286 | +0.714 | |
| Brierley, John* | 21 | 33% | 24% | 43% | 1.238 | 1.714 | 1.810 | -0.095 | |
| Thompson, Maralyn* | 21 | 38% | 19% | 43% | 1.333 | 2.238 | 1.571 | +0.667 | |
| Nurse, Cameron* | 21 | 52% | 10% | 38% | 1.667 | 2.619 | 2.524 | +0.095 | |
| Murphy, Mathew* | 21 | 29% | 10% | 62% | 0.952 | 1.810 | 2.905 | -1.095 | |
| Bonnici, Brad* | 20 | 20% | 5% | 75% | 0.650 | 1.450 | 2.750 | -1.300 | |
| James, William* | 19 | 58% | 5% | 37% | 1.789 | 2.737 | 2.368 | +0.368 | |
| Lawrence, Stephen* | 19 | 42% | 16% | 42% | 1.421 | 2.474 | 1.842 | +0.632 | |
| Neff, Darren* | 18 | 17% | 17% | 67% | 0.667 | 1.667 | 3.389 | -1.722 | |
| Lawrence, Richard* | 18 | 33% | 11% | 56% | 1.111 | 1.722 | 1.944 | -0.222 | |
| Hardy, Dale* | 17 | 53% | 18% | 29% | 1.765 | 1.765 | 1.118 | +0.647 | |
| Cameron, John* | 17 | 59% | 12% | 29% | 1.882 | 2.647 | 1.000 | +1.647 | |
| Salvatore, Joel* | 17 | 24% | 6% | 71% | 0.765 | 1.824 | 2.353 | -0.529 | |
| Govan, Jeff* | 16 | 50% | 25% | 25% | 1.750 | 2.375 | 1.000 | +1.375 | |
| Williams, Lisa* | 15 | 13% | 13% | 73% | 0.533 | 1.133 | 2.667 | -1.533 | |
| Knight, Jason* | 15 | 27% | 20% | 53% | 1.000 | 1.200 | 3.133 | -1.933 | |
| Scherer, Tim* | 15 | 27% | 13% | 60% | 0.933 | 0.933 | 1.600 | -0.667 | |
| Bairstow, Michael* | 15 | 33% | 13% | 53% | 1.133 | 2.133 | 2.333 | -0.200 | |
| Eller, Karen* | 15 | 33% | 20% | 47% | 1.200 | 1.667 | 1.867 | -0.200 | |
| Downes, Lana* | 14 | 43% | 29% | 29% | 1.571 | 1.643 | 1.143 | +0.500 | |
| Lawrence, Glenn* | 14 | 43% | 7% | 50% | 1.357 | 1.214 | 2.071 | -0.857 | |
| Lawrence, Geoffrey* | 14 | 57% | 7% | 36% | 1.786 | 2.714 | 2.429 | +0.286 | |
| Klaebe, Carrol* | 13 | 77% | 8% | 15% | 2.385 | 2.462 | 1.538 | +0.923 | |
| Haddy, Thomas* | 13 | 23% | 8% | 69% | 0.769 | 1.692 | 2.308 | -0.615 | |
| Powderly, Darryl* | 12 | 58% | 8% | 33% | 1.833 | 2.667 | 1.083 | +1.583 | |
| Daniel, Annesley* | 12 | 33% | 17% | 50% | 1.167 | 1.667 | 1.333 | +0.333 | |
| Salvatore, Aaron* | 12 | 8% | 8% | 83% | 0.333 | 1.500 | 2.583 | -1.083 | |
| Haddy, Stephen* | 12 | 25% | 75% | 0.750 | 1.500 | 2.417 | -0.917 | ||
| Ferguson, Jack* | 12 | 25% | 8% | 67% | 0.833 | 2.000 | 2.583 | -0.583 | |
| Sorensen, Steven* | 11 | 18% | 18% | 64% | 0.727 | 1.727 | 3.545 | -1.818 | |
| McElroy, Rik* | 10 | 70% | 30% | 2.100 | 2.600 | 1.900 | +0.700 | ||
| James, Daniel* | 10 | 50% | 50% | 1.500 | 2.800 | 2.900 | -0.100 | ||
| Galea, John* | 10 | 80% | 20% | 2.400 | 3.400 | 1.700 | +1.700 | ||
| Schwarze, Royce* | 10 | 20% | 30% | 50% | 0.900 | 2.200 | 1.800 | +0.400 | |
| Azzopardi, Justin* | 10 | 20% | 10% | 70% | 0.700 | 2.200 | 2.500 | -0.300 | |
| Fallowfield, Shelly* | 10 | 30% | 10% | 60% | 1.000 | 1.600 | 1.700 | -0.100 | |
| Arnold, Chris* | 9 | 67% | 33% | 2.000 | 3.333 | 2.333 | +1.000 | ||
| Gorton, David* | 9 | 44% | 11% | 44% | 1.444 | 2.333 | 4.111 | -1.778 | |
| Otter, Eddie* | 9 | 22% | 78% | 0.667 | 1.222 | 2.222 | -1.000 | ||
| Brazil, Sean* | 8 | 88% | 13% | 2.625 | 3.500 | 1.375 | +2.125 | ||
| Caiafa, Sebastian* | 8 | 38% | 13% | 50% | 1.250 | 1.875 | 3.000 | -1.125 | |
| Buttigieg, William* | 8 | 13% | 25% | 63% | 0.625 | 1.125 | 3.625 | -2.500 | |
| Kouroumalos, Deon* | 8 | 25% | 75% | 0.750 | 1.875 | 2.750 | -0.875 | ||
| Allen, Mark* | 8 | 13% | 88% | 0.375 | 1.375 | 2.625 | -1.250 | ||
| Cannon, Peter* | 7 | 43% | 57% | 1.286 | 1.571 | 3.000 | -1.429 | ||
| Granville, Alan* | 6 | 17% | 17% | 67% | 0.667 | 0.500 | 2.167 | -1.667 | |
| Armitage, Callan* | 6 | 17% | 17% | 67% | 0.667 | 2.333 | 4.500 | -2.167 | |
| Armitage, Timothy* | 6 | 17% | 83% | 0.167 | 1.500 | 4.000 | -2.500 | ||
| Micallef, Reuben* | 6 | 17% | 83% | 0.500 | 1.667 | 4.167 | -2.500 | ||
| Blackwell, Grahame* | 6 | 33% | 67% | 1.000 | 1.667 | 1.667 | +0.000 | ||
| Gregorio, Callum* | 6 | 33% | 67% | 1.000 | 1.833 | 1.667 | +0.167 | ||
| Iosua, Rachael* | 6 | 50% | 50% | 1.500 | 2.500 | 1.333 | +1.167 | ||
| Knight, Tristan* | 5 | 40% | 60% | 1.200 | 1.000 | 4.000 | -3.000 | ||
| Takano, Doug* | 5 | 20% | 20% | 60% | 0.800 | 1.000 | 3.200 | -2.200 | |
| Caiafa, Kobe* | 5 | 40% | 60% | 1.200 | 1.600 | 3.000 | -1.400 | ||
| Cumming, Sebastian* | 5 | 20% | 80% | 0.600 | 1.400 | 4.600 | -3.200 | ||
| Micallef, Levi* | 5 | 20% | 80% | 0.600 | 1.600 | 3.800 | -2.200 | ||
| Taylor, Harvey* | 5 | 20% | 80% | 0.600 | 1.400 | 2.400 | -1.000 | ||
| Morris, Sebastian* | 5 | 20% | 20% | 60% | 0.800 | 2.200 | 2.400 | -0.200 | |
| Jennings, Ian* | 4 | 50% | 50% | 1.500 | 2.250 | 2.250 | +0.000 | ||
| Thomas, Kerry* | 4 | 50% | 50% | 1.500 | 2.250 | 2.250 | +0.000 | ||
| Downs, Conrad* | 4 | 25% | 25% | 50% | 1.000 | 1.250 | 1.500 | -0.250 | |
| Knipe, Lucas* | 4 | 100% | 0.000 | 2.250 | 6.000 | -3.750 | |||
| Hooley, Ryan* | 4 | 25% | 75% | 0.250 | 1.000 | 6.500 | -5.500 | ||
| Meehan, James* | 4 | 25% | 75% | 0.250 | 1.000 | 4.750 | -3.750 | ||
| Kuchel, Joshua* | 4 | 100% | 0.000 | 1.750 | 5.250 | -3.500 | |||
| McMurrie, Tom* | 4 | 100% | 0.000 | 1.500 | 2.500 | -1.000 | |||
| Street, Joshua* | 4 | 100% | 0.000 | 1.000 | 5.500 | -4.500 | |||
| Williams, Mark* | 4 | 50% | 50% | 1.500 | 2.500 | 1.500 | +1.000 | ||
| Borg, Vicki* | 3 | 100% | 0.000 | 0.333 | 4.333 | -4.000 | |||
| Holahan, Zac* | 3 | 33% | 67% | 0.333 | 1.333 | 5.667 | -4.333 | ||
| Kuchel, Kel* | 3 | 33% | 33% | 33% | 1.333 | 2.000 | 2.333 | -0.333 | |
| Grace, Tim* | 3 | 33% | 33% | 33% | 1.333 | 1.667 | 1.333 | +0.333 | |
| Lawrence, Brody* | 3 | 33% | 67% | 1.000 | 3.000 | 3.667 | -0.667 | ||
| Caiafa, Jackson* | 3 | 100% | 0.000 | 1.333 | 3.333 | -2.000 | |||
| Deol, Manpreet* | 3 | 33% | 67% | 1.000 | 1.667 | 2.000 | -0.333 | ||
| Govan, Rosalie* | 2 | 100% | 1.000 | 1.000 | 1.000 | +0.000 | |||
| Clotworthy, Joshua* | 2 | 100% | 0.000 | 2.500 | 6.000 | -3.500 | |||
| Fawcett, Tom* | 2 | 100% | 0.000 | 2.500 | 6.000 | -3.500 | |||
| Griffiths, Rylee* | 2 | 100% | 0.000 | 2.500 | 6.000 | -3.500 | |||
| Strobel, Joshua* | 2 | 100% | 0.000 | 0.000 | 6.500 | -6.500 | |||
| McMurrie, Michael* | 2 | 100% | 0.000 | 2.500 | 8.500 | -6.000 | |||
| Hosking, Michael* | 2 | 100% | 0.000 | 1.500 | 5.000 | -3.500 | |||
| Jungfer, Kathy* | 2 | 100% | 0.000 | 1.500 | 4.000 | -2.500 | |||
| Scherer, Thomas* | 2 | 50% | 50% | 1.500 | 1.000 | 2.000 | -1.000 | ||
| Vallance, Liam* | 2 | 100% | 0.000 | 2.500 | 5.000 | -2.500 | |||
| Lakey, Ryan | 2 | 100% | 0.000 | 0.000 | 6.500 | -6.500 | |||
| Sutton, Shaun* | 2 | 50% | 50% | 1.500 | 3.000 | 2.500 | +0.500 | ||
| Burgan, Deeon | 2 | 100% | 0.000 | 0.500 | 2.500 | -2.000 | |||
| Baker, Daniel* | 2 | 50% | 50% | 1.500 | 2.500 | 1.500 | +1.000 | ||
| Wright, Tim* | 2 | 50% | 50% | 1.500 | 2.500 | 2.000 | +0.500 | ||
| Substitute, | 1 | 100% | 0.000 | 1.000 | 3.000 | -2.000 | |||
| Substitute, | 1 | 100% | 0.000 | 1.000 | 3.000 | -2.000 | |||
| Jenkins, Barbara* | 1 | 100% | 0.000 | 2.000 | 3.000 | -1.000 | |||
| D`Souza, Leon* | 1 | 100% | 3.000 | 3.000 | 0.000 | +3.000 | |||
| Docherty, Benjamin* | 1 | 100% | 0.000 | 0.000 | 4.000 | -4.000 | |||
| Gray, Deane | 1 | 100% | 0.000 | 0.000 | 4.000 | -4.000 | |||
| Humphrey, Hayden | 1 | 100% | 0.000 | 5.000 | 8.000 | -3.000 | |||
| Pugh, Tim | 1 | 100% | 0.000 | 2.000 | 4.000 | -2.000 | |||
| James, Kylie-Faye* | 1 | 100% | 3.000 | 4.000 | 1.000 | +3.000 | |||
| Clough, Jarryd* | 1 | 100% | 0.000 | 0.000 | 5.000 | -5.000 | |||
| McMillan, Roger | 1 | 100% | 0.000 | 0.000 | 9.000 | -9.000 | |||
| Berns, Alannah* | 1 | 100% | 0.000 | 0.000 | 8.000 | -8.000 | |||
| Gati, Nick* | 1 | 100% | 3.000 | 6.000 | 0.000 | +6.000 | |||
| Downs, Andrew* | 1 | 100% | 3.000 | 4.000 | 2.000 | +2.000 | |||
| Lawrence, Tony* | 1 | 100% | 0.000 | 0.000 | 8.000 | -8.000 | |||
| Brotherton, Arlene* | 1 | 100% | 3.000 | 1.000 | 0.000 | +1.000 | |||
| Currie, Fraser* | 1 | 100% | 0.000 | 1.000 | 3.000 | -2.000 | |||
| Fletcher-Gass, Jesse* | 1 | 100% | 0.000 | 1.000 | 3.000 | -2.000 | |||
| Kaplan, Sue* | 1 | 100% | 3.000 | 2.000 | 1.000 | +1.000 | |||
| VellaVanKassel, Chris* | 1 | 100% | 0.000 | 0.000 | 3.000 | -3.000 | |||
| Abraham, Liam* | 1 | 100% | 3.000 | 4.000 | 1.000 | +3.000 | |||
| Hanley-Wood, Ben* | 1 | 100% | 1.000 | 3.000 | 3.000 | +0.000 | |||
| Vallance, Lachlan* | 1 | 100% | 1.000 | 3.000 | 3.000 | +0.000 | |||
| Singh, Parminder* | 1 | 100% | 3.000 | 3.000 | 1.000 | +2.000 | |||
| Closter, Seth* | 1 | 100% | 0.000 | 1.000 | 5.000 | -4.000 | |||
| Walther, Erica* | 1 | 100% | 0.000 | 1.000 | 2.000 | -1.000 | |||
| Berns, Hayden | 1 | 100% | 0.000 | 0.000 | 3.000 | -3.000 | |||
| Bonnici, Samuel* | 1 | 100% | 0.000 | 0.000 | 3.000 | -3.000 | |||
| Davis, Brett* | 1 | 100% | 0.000 | 0.000 | 3.000 | -3.000 | |||
| Wilson, Christopher* | 1 | 100% | 0.000 | 0.000 | 3.000 | -3.000 |
Opposition Teams
| Opponent |
Games |
Goals | Avge |
Win % | Draw % | Loss % | Unkn % | Avge. Points |
Avge. For | Avge. Aga | Avge. Diff. |
G.K. Games | Shut- outs | Shut- out % | Goals In | Goals Avge |
|---|---|---|---|---|---|---|---|---|---|---|---|---|---|---|---|---|
| Footscray | 22 | 32% | 9% | 59% | 1.045 | 1.682 | 2.500 | -0.818 | ||||||||
| Essendon | 18 | 28% | 6% | 67% | 0.889 | 1.500 | 2.889 | -1.389 | ||||||||
| MCC | 14 | 2 | 0.143 | 71% | 14% | 14% | 2.286 | 2.929 | 0.714 | +2.214 | ||||||
| Latrobe Uni | 11 | 27% | 9% | 64% | 0.909 | 2.182 | 3.545 | -1.364 | ||||||||
| Camberwell | 11 | 27% | 9% | 64% | 0.909 | 1.818 | 2.000 | -0.182 | ||||||||
| Powerhouse | 10 | 10% | 40% | 50% | 0.700 | 0.600 | 2.200 | -1.600 | ||||||||
| Elwood | 10 | 50% | 30% | 20% | 1.800 | 1.900 | 1.300 | +0.600 | ||||||||
| Geelong | 9 | 56% | 11% | 33% | 1.778 | 1.667 | 2.222 | -0.556 | ||||||||
| MUHC | 9 | 56% | 11% | 33% | 1.778 | 1.556 | 1.000 | +0.556 | ||||||||
| Brunswick | 9 | 33% | 44% | 22% | 1.444 | 1.444 | 1.333 | +0.111 | ||||||||
| PEGS | 8 | 63% | 13% | 25% | 2.000 | 3.250 | 2.000 | +1.250 | ||||||||
| Altona | 7 | 14% | 14% | 71% | 0.571 | 2.286 | 3.857 | -1.571 | ||||||||
| Yarra Valley | 7 | 29% | 14% | 57% | 1.000 | 1.714 | 2.143 | -0.429 | ||||||||
| Hawthorn | 6 | 17% | 83% | 0.167 | 1.000 | 2.667 | -1.667 | |||||||||
| Box Hill | 6 | 33% | 33% | 33% | 1.333 | 1.833 | 1.333 | +0.500 | ||||||||
| Hume | 6 | 33% | 67% | 1.000 | 1.667 | 2.500 | -0.833 | |||||||||
| Collegians-X | 5 | 40% | 60% | 1.200 | 2.000 | 2.000 | +0.000 | |||||||||
| Werribee | 4 | 25% | 75% | 0.250 | 1.250 | 4.000 | -2.750 | |||||||||
| Greensborough | 4 | 25% | 75% | 0.750 | 1.250 | 2.000 | -0.750 | |||||||||
| Ajax-Maccabi | 3 | 67% | 33% | 2.000 | 3.000 | 3.000 | +0.000 | |||||||||
| MHSOB | 3 | 67% | 33% | 2.000 | 4.000 | 1.667 | +2.333 | |||||||||
| Brunswick-Greens | 3 | 33% | 67% | 1.000 | 1.667 | 2.667 | -1.000 | |||||||||
| St.Bernards | 3 | 67% | 33% | 2.000 | 2.667 | 2.333 | +0.333 | |||||||||
| Whittlesea | 3 | 33% | 67% | 0.333 | 1.333 | 3.667 | -2.333 | |||||||||
| Craigieburn | 3 | 100% | 0.000 | 1.333 | 3.000 | -1.667 | ||||||||||
| Eastern | 2 | 100% | 3.000 | 4.000 | 0.000 | +4.000 | ||||||||||
| Mentone | 2 | 50% | 50% | 2.000 | 1.000 | 0.000 | +1.000 | |||||||||
| Plenty Valley | 2 | 50% | 50% | 1.500 | 3.500 | 1.500 | +2.000 | |||||||||
| Kew | 2 | 100% | 0.000 | 0.000 | 4.000 | -4.000 | ||||||||||
| Old Carey | 2 | 50% | 50% | 1.500 | 2.000 | 2.500 | -0.500 | |||||||||
| Caroline Springs | 2 | 100% | 0.000 | 1.500 | 2.500 | -1.000 | ||||||||||
| RMIT | 2 | 100% | 0.000 | 1.500 | 4.000 | -2.500 | ||||||||||
| TEM | 1 | 100% | 3.000 | 3.000 | 1.000 | +2.000 | ||||||||||
| Melton | 1 | 100% | 0.000 | 0.000 | 2.000 | -2.000 | ||||||||||
| United Khalsa | 1 | 100% | 3.000 | 3.000 | 1.000 | +2.000 | ||||||||||
| Opponents :35 | 211 | 2 | 0.009 | 36% | 14% | 50% | 1.218 | 1.858 | 2.213 | -0.355 |
Playing Venues
| Venue | Games |
Goals | Avge. |
Win % | Draw % | Loss % | Unkn % | Avge. Points |
Avge. For | Avge. Aga | Avge. Diff. |
G.K. Games | Shut- outs | Shut- out % | Goals In | Goals Avge. |
|---|---|---|---|---|---|---|---|---|---|---|---|---|---|---|---|---|
| Melton | 42 | 43% | 14% | 43% | 1.429 | 2.071 | 1.810 | +0.262 | ||||||||
| Melton Mowbray | 39 | 51% | 21% | 28% | 1.744 | 2.487 | 1.513 | +0.974 | ||||||||
| Footscray | 22 | 27% | 5% | 68% | 0.864 | 1.409 | 2.682 | -1.273 | ||||||||
| Melbourne High | 20 | 2 | 0.100 | 55% | 25% | 20% | 1.900 | 2.500 | 1.350 | +1.150 | ||||||
| Essendon | 11 | 9% | 18% | 73% | 0.455 | 1.000 | 3.455 | -2.455 | ||||||||
| Melbourne Uni | 10 | 70% | 30% | 2.100 | 1.900 | 1.300 | +0.600 | |||||||||
| SHC | 7 | 29% | 71% | 0.857 | 2.286 | 2.714 | -0.429 | |||||||||
| Hume | 6 | 17% | 83% | 0.500 | 1.333 | 2.833 | -1.500 | |||||||||
| Albert Park | 5 | 40% | 60% | 1.200 | 2.400 | 2.800 | -0.400 | |||||||||
| Hawthorn | 5 | 20% | 80% | 0.200 | 1.200 | 2.800 | -1.600 | |||||||||
| Altona | 5 | 40% | 60% | 1.200 | 2.000 | 3.000 | -1.000 | |||||||||
| PSF | 5 | 40% | 20% | 40% | 1.400 | 2.600 | 2.400 | +0.200 | ||||||||
| Yarra Valley | 4 | 25% | 75% | 0.250 | 0.750 | 2.500 | -1.750 | |||||||||
| Greensborough | 4 | 100% | 0.000 | 0.750 | 2.500 | -1.750 | ||||||||||
| Brunswick | 4 | 25% | 25% | 50% | 1.000 | 1.750 | 2.250 | -0.500 | ||||||||
| Camberwell | 4 | 100% | 0.000 | 0.250 | 2.750 | -2.500 | ||||||||||
| Elgar Park | 3 | 100% | 0.000 | 0.333 | 3.000 | -2.667 | ||||||||||
| Reservoir | 3 | 100% | 0.000 | 0.000 | 7.000 | -7.000 | ||||||||||
| Geelong | 2 | 50% | 50% | 0.500 | 1.000 | 3.000 | -2.000 | |||||||||
| Werribee | 2 | 100% | 0.000 | 1.000 | 6.000 | -5.000 | ||||||||||
| St.Bernards | 2 | 100% | 3.000 | 4.000 | 1.500 | +2.500 | ||||||||||
| Bundoora | 2 | 100% | 0.000 | 0.500 | 4.000 | -3.500 | ||||||||||
| Mentone | 1 | 100% | 1.000 | 0.000 | 0.000 | +0.000 | ||||||||||
| Knox | 1 | 100% | 3.000 | 3.000 | 0.000 | +3.000 | ||||||||||
| Waverley | 1 | 100% | 0.000 | 0.000 | 4.000 | -4.000 | ||||||||||
| Box Hill | 1 | 100% | 1.000 | 1.000 | 1.000 | +0.000 | ||||||||||
| Venues :26 | 211 | 2 | 0.009 | 36% | 14% | 50% | 1.218 | 1.858 | 2.213 | -0.355 |