 |
Melton Hockey Club |
|
Last updated : 11:21 am - 2 November 2023

Club Cap : 231
(Games : 278, Goals : 94 )
First XI Men's Cap : 66
(Games : 30, Goals : 3)
First XI Vet's Cap : 71
(Games : 5, Goals : 1)
Milestones
| 1988-Apr-16 : | First Junior game (R-01: 1988 U11 North) |
| 1988-Apr-16 : | First game (R-01: 1988 U11 North) |
| 1990-Jan-02 : | First goal scored (Melton 2 def. Essendon (Black) 0. R-02: 1990 U13 North) |
| 1990-Jan-03 : | 50 Junior games (Altona 2 def. Melton 1. R-03: 1990 U13 North) |
| 1992-May-23 : | First Senior game (Melton 1 def. Camberwell 0. R-06: 1992 Metro 2 West Men) |
| 1992-Aug-08 : | 100 Junior games (Footscray 1 def. Melton 0. R-15: 1992 U17 North) |
| 1993-May-02 : | First Senior goal (Melton 5 def. Footscray 0. R-03: 1993 Metro 2 West Men) |
| 1993-Aug-22 : | First First XI Mens game (Melton 2 def. Powerhouse 1. R-17: 1993 State League 4 Men) |
| 1994-Aug-26 : | Last Junior game (Melton 7 def. Camberwell 5. GF: 1994 U17 North) |
| 2007-Apr-21 : | Last First XI Mens game played (Melton 1 drew Eastern 1. R-01: 2007 State League 4 Men) |
| 2023-Jun-05 : | First Veteran game (Footscray 1 def. Melton 0. R-07: 2023 Masters 45+ NW) |
| 2023-Jul-17 : | First Veteran goal (Melton 4 def. Greensborough 0. R-10: 2023 Masters 45+ NW) |
| 2023-Aug-05 : | Last Senior game (Melton 4 def. Hume 0. R-15: 2023 Metro 2 North/West Men) |
| 2023-Aug-07 : | Last Veteran game (PEGS 3 def. Melton 2. R-13: 2023 Masters 45+ NW) |
| 2023-Aug-07 : | Last game played (PEGS 3 def. Melton 2. R-13: 2023 Masters 45+ NW) |
| Playing career : 12896 days. (35 years and 121 days.) |
Honours, Trophies, and Official Roles
| Committee member : | 1993/94 |
| Top Junior Scorer (Win.) : | 1990/91 |
| B&F Runner Up : | 1994-Metro 2 West Men, 2006-Metro 3 West Men |
| Captain : | 1994-U17 North |
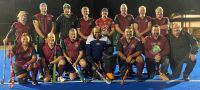
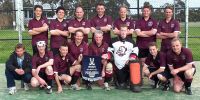
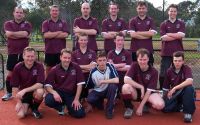
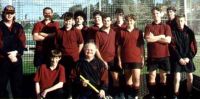
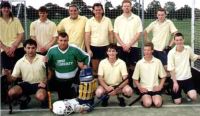
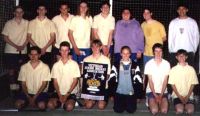
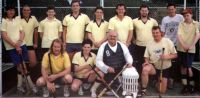
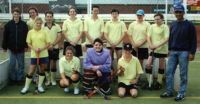
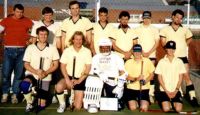
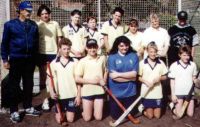
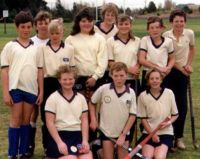
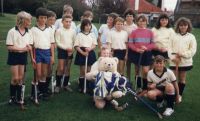
Team Photographs
Complete Playing History
Teams played with : 31
Premierships won : 3
Wooden Spoons : 3
| Games as Player |
Games Won | Games Drawn | Games Lost | Games Unkn. |
Total | Goals | Goalscoring Average |
|---|---|---|---|---|---|---|---|
| Junior Winter | 57 | 4 | 12 | 52 | 125 | 61 | 1.151 |
| Junior Summer | 1 | 1 | 6 | 0 | 8 | 0 | 0.000 |
| Junior Total | 58 | 5 | 18 | 52 | 133 | 61 | 1.000 |
| Senior Winter | 66 | 19 | 52 | 0 | 137 | 31 | 0.242 |
| Senior Summer | 0 | 0 | 3 | 0 | 3 | 1 | 0.333 |
| Senior Total | 66 | 19 | 55 | 0 | 140 | 32 | 0.244 |
| Veteran Winter | 2 | 0 | 3 | 0 | 5 | 1 | 0.200 |
| Total | 126 | 24 | 76 | 52 | 278 | 94 | 0.477 |
| Pos. | PR/WS | Div. | Competition | Games | Goals | Avge. | Won | Drawn | Lost | Unkn | Avge.For | Avge.Aga | Avge.Diff | G.For | G.Aga | GoalDiff |
|---|---|---|---|---|---|---|---|---|---|---|---|---|---|---|---|---|
| 7 | 2023 Metro 2 North/West Men* | 1 | 1 | 4.000 | 0.000 | +4.000 | 4 | 0 | +004 | |||||||
| 6 | 2023 Masters 45+ NW* | 5 | 1 | 0.200 | 2 | 3 | 2.000 | 1.400 | +0.600 | 10 | 7 | +003 | ||||
| 6 | 2008 Metro 2 West Men* | 2 | 2 | 1.500 | 1.500 | +0.000 | 3 | 3 | +000 | |||||||
| 9 | 2008 Metro 3 West Men* | 1 | 1 | 2.000 | 9.000 | -7.000 | 2 | 9 | -007 | |||||||
| 5 | 2007 State League 4 Men* | 1 | 1 | 1.000 | 1.000 | +0.000 | 1 | 1 | +000 | |||||||
| 3 | 2007 Metro 2 West Men* | 10 | 5 | 0.500 | 7 | 1 | 2 | 2.700 | 0.700 | +2.000 | 27 | 7 | +020 | |||
| 1 | PR | 2006 Metro 3 West Men* | 12 | 8 | 0.667 | 9 | 3 | 4.000 | 0.833 | +3.167 | 48 | 10 | +038 | |||
| 4 | 2005 Metro 3 West Men* | 2 | 2 | 4.000 | 0.500 | +3.500 | 8 | 1 | +007 | |||||||
| 9 | 2004 State League 4 Men* | 2 | 1 | 1 | 2.500 | 4.000 | -1.500 | 5 | 8 | -003 | ||||||
| 2 | 2004 Metro 3 West Men* | 13 | 6 | 0.462 | 9 | 1 | 3 | 4.846 | 1.923 | +2.923 | 63 | 25 | +038 | |||
| 3 | 2003 State League 5 Men* | 15 | 1 | 0.067 | 8 | 4 | 3 | 2.133 | 1.333 | +0.800 | 32 | 20 | +012 | |||
| 2 | 2003 Metro 4 West Men* | 5 | 5 | 7.000 | 1.400 | +5.600 | 35 | 7 | +028 | |||||||
| 4 | 1997 Metro 3 West Men* | 6 | 2 | 2 | 2 | 3.667 | 2.667 | +1.000 | 22 | 16 | +006 | |||||
| 7 | 1996/97 SHC Saturday Mixed | 1 | 1 | 2.000 | 6.000 | -4.000 | 2 | 6 | -004 | |||||||
| 8 | 1996 Metro 3 West Men* | 10 | 1 | 0.100 | 6 | 4 | 4.100 | 2.400 | +1.700 | 41 | 24 | +017 | ||||
| 10 | WS | 1995 State League 4 Men* | 8 | 1 | 0.125 | 2 | 6 | 0.875 | 4.250 | -3.375 | 7 | 34 | -027 | |||
| 4 | 1995 Metro 3 West Men* | 4 | 2 | 2 | 4.750 | 3.500 | +1.250 | 19 | 14 | +005 | ||||||
| 4 | 1994 State League 4 Men* | 3 | 1 | 0.333 | 1 | 1 | 1 | 4.333 | 2.000 | +2.333 | 13 | 6 | +007 | |||
| 9 | 1994 Metro 2 West Men* | 13 | 6 | 0.462 | 3 | 1 | 9 | 0.769 | 2.769 | -2.000 | 10 | 36 | -026 | |||
| 1 | PR | 1994 U17 North* | 12 | 16 | 1.333 | 11 | 1 | 6.417 | 1.917 | +4.500 | 77 | 23 | +054 | |||
| 8 | WS | 1993/94 SHC Sunday Mixed | 2 | 1 | 0.500 | 2 | 1.000 | 3.000 | -2.000 | 2 | 6 | -004 | ||||
| 5 | 1993 State League 4 Men* | 1 | 1 | 2.000 | 1.000 | +1.000 | 2 | 1 | +001 | |||||||
| 6 | 1993 Metro 2 West Men* | 15 | 2 | 0.133 | 4 | 1 | 10 | 1.667 | 1.933 | -0.267 | 25 | 29 | -004 | |||
| 2 | 1993 U17 North* | 17 | 18 | 1.059 | 14 | 1 | 2 | 3.765 | 0.882 | +2.882 | 64 | 15 | +049 | |||
| 5 | 1992 Metro 2 West Men | 13 | 6 | 7 | 1.615 | 1.769 | -0.154 | 21 | 23 | -002 | ||||||
| 3 | 1992 U17 North* | 17 | 11 | 1 | 5 | 2.471 | 1.118 | +1.353 | 42 | 19 | +023 | |||||
| 2 | 1991 U15 North | 20 | 7 | 1.750 | 2 | 1 | 1 | 16 | 3.250 | 1.250 | +2.000 | 13 | 5 | +008 | ||
| 1 | PR | 1990 U13 North* | 20 | 20 | 1.000 | 18 | 1 | 1 | 2.600 | 0.300 | +2.300 | 52 | 6 | +046 | ||
| 5 | WS | 1989/90 U13 Indoor | 8 | 1 | 1 | 6 | 1.250 | 7.750 | -6.500 | 10 | 62 | -052 | ||||
| 4 | 1989 U13 North* | 19 | 1 | 18 | 0.000 | 0.000 | +0.000 | 0 | 0 | +000 | ||||||
| 2 | 1988 U11 North* | 20 | 1 | 1 | 18 | 0.500 | 1.000 | -0.500 | 1 | 2 | -001 | |||||
| 278 | 94 | 0.416 | 126 | 24 | 76 | 52 | 2.991 | 1.881 | +1.044 | 661 | 425 | +236 |
Junior Winter Playing History
| Games as Player |
Games Won | Games Drawn | Games Lost | Games Unkn. |
Total | Goals | Goalscoring Average |
|---|---|---|---|---|---|---|---|
| Junior Winter | 57 | 4 | 12 | 52 | 125 | 61 | 1.151 |
| First Game : | R-01: 1988 U11 North |
| Last Game : | Melton 7 def. Camberwell 5. GF: 1994 U17 North |
| Best Win : | Melton 16 def. Yarra Valley 0. R-05: 1994 U17 North |
| Worst Loss : | Footscray 4 def. Melton 0. R-06: 1992 U17 North |
| 1 goal games : | 14 times. Last : Melton 7 def. Camberwell 5. GF: 1994 U17 North |
| 2 goal games : | 12 times. Last : Melton 8 def. Brunswick 1. R-12: 1994 U17 North |
| 3 goal games : | 3 times. Last : Melton 6 def. Camberwell 2. R-04: 1994 U17 North |
| 4 goal games : | 2 times. Last : Melton 8 def. Kew (Blue) 0. R-18: 1990 U13 North |
| 6 goal games : | 1 times. Last : Melton 10 def. MHSOB 0. R-01: 1991 U15 North |
| Finals : | MUHC 2 def. Melton 1. GF: 1988 U11 North Melton 0 def. Altona 0. SF: 1988 U11 North Altona 0 def. Melton 0. SF: 1989 U13 North Melton 1 def. Kew (White) 0. GF: 1990 U13 North Melton 3 def. Essendon 1. SF: 1990 U13 North Altona 4 def. Melton 2. GF: 1991 U15 North Melton 1 def. Brunswick 1. SF: 1991 U15 North Box Hill 3 def. Melton 0. SF: 1992 U17 North Camberwell 2 def. Melton 1. GF: 1993 U17 North Melton 5 def. Altona 1. SF: 1993 U17 North Melton 7 def. Camberwell 5. GF: 1994 U17 North Melton 4 def. Brunswick 1. SF: 1994 U17 North |
| Premierships : | Melton 1 def. Kew (White) 0. GF: 1990 U13 North Melton 7 def. Camberwell 5. GF: 1994 U17 North |
Junior Summer Playing History
| Games as Player |
Games Won | Games Drawn | Games Lost | Games Unkn. |
Total | Goals | Goalscoring Average |
|---|---|---|---|---|---|---|---|
| Junior Summer | 1 | 1 | 6 | 0 | 8 | 0 | 0.000 |
| First Game : | Werribee 13 def. Melton 0. R-01: 1989/90 U13 Indoor |
| Last Game : | Essendon 4 def. Melton 2. R-08: 1989/90 U13 Indoor |
| Best Win : | Melton 3 def. Essendon 2. R-04: 1989/90 U13 Indoor |
| Worst Loss : | Brunswick 17 def. Melton 0. R-03: 1989/90 U13 Indoor |
| Finals : | None. |
| Premierships : | None. |
Senior Winter Playing History
| Games as Player |
Games Won | Games Drawn | Games Lost | Games Unkn. |
Total | Goals | Goalscoring Average |
|---|---|---|---|---|---|---|---|
| Senior Winter | 66 | 19 | 52 | 0 | 137 | 31 | 0.242 |
| First Game : | Melton 1 def. Camberwell 0. R-06: 1992 Metro 2 West Men |
| Last Game : | Melton 4 def. Hume 0. R-15: 2023 Metro 2 North/West Men |
| Best Win : | Melton 14 def. RMIT 0. R-02: 2003 Metro 4 West Men |
| Worst Loss : | RMIT 9 def. Melton 2. R-07: 2008 Metro 3 West Men |
| 1 goal games : | 19 times. Last : Melton 3 def. Essendon 1. R-16: 2007 Metro 2 West Men |
| 2 goal games : | 6 times. Last : Melton 4 def. Greensborough 2. R-15: 2007 Metro 2 West Men |
| Finals : | MUHC 2 def. Melton 1. SF: 1997 Metro 3 West Men Baw-Baw 1 def. Melton 0. PF: 2003 State League 5 Men St.Bedes 4 def. Melton 1. SF: 2003 State League 5 Men Brunswick 2 def. Melton 1. GF: 2004 Metro 3 West Men Melton 6 def. Essendon 4. SF: 2004 Metro 3 West Men Melton 4 def. Old Melburnians 2. GF: 2006 Metro 3 West Men Melton 2 def. Footscray 0. PF: 2006 Metro 3 West Men Old Melburnians 1 def. Melton 0. SF: 2006 Metro 3 West Men Altona 1 def. Melton 0. PF: 2007 Metro 2 West Men Old Melburnians 1 def. Melton 0. SF: 2007 Metro 2 West Men |
| Premierships : | Melton 4 def. Old Melburnians 2. GF: 2006 Metro 3 West Men |
Senior Summer Playing History
| Games as Player |
Games Won | Games Drawn | Games Lost | Games Unkn. |
Total | Goals | Goalscoring Average |
|---|---|---|---|---|---|---|---|
| Senior Summer | 0 | 0 | 3 | 0 | 3 | 1 | 0.333 |
| First Game : | Greensborough (1) 4 def. Melton 2. R-01: 1993/94 SHC Sunday Mixed |
| Last Game : | Altona 6 def. Melton 2. R-08: 1996/97 SHC Saturday Mixed |
| Worst Loss : | Altona 6 def. Melton 2. R-08: 1996/97 SHC Saturday Mixed |
| 1 goal games : | 1 times. Last : Greensborough (1) 4 def. Melton 2. R-01: 1993/94 SHC Sunday Mixed |
| Finals : | None. |
| Premierships : | None. |
Veteran Winter Playing History
| Games as Player |
Games Won | Games Drawn | Games Lost | Games Unkn. |
Total | Goals | Goalscoring Average |
|---|---|---|---|---|---|---|---|
| Veteran Winter | 2 | 0 | 3 | 0 | 5 | 1 | 0.200 |
| First Game : | Footscray 1 def. Melton 0. R-07: 2023 Masters 45+ NW |
| Last Game : | PEGS 3 def. Melton 2. R-13: 2023 Masters 45+ NW |
| Best Win : | Melton 4 def. Essendon 0. R-12: 2023 Masters 45+ NW |
| Worst Loss : | Camberwell (T) 3 def. Melton 0. R-11: 2023 Masters 45+ NW |
| 1 goal games : | 1 times. Last : Melton 4 def. Greensborough 0. R-10: 2023 Masters 45+ NW |
| Finals : | None. |
| Premierships : | None. |
Teammates
Number of teammates :148
| Player |
Games |
Win % | Draw % | Loss % | Unkn % | Avge. Points |
Avge. For | Avge. Aga | Avge. Diff. |
|---|---|---|---|---|---|---|---|---|---|
| Lawrence, Stephen* | 170 | 46% | 6% | 16% | 31% | 2.102 | 3.381 | 1.390 | +1.992 |
| Kari, Grant* | 157 | 43% | 5% | 19% | 33% | 1.990 | 2.924 | 1.362 | +1.562 |
| Treganowan, Brad* | 146 | 42% | 4% | 18% | 36% | 2.043 | 2.883 | 1.383 | +1.500 |
| Duffy, Craig* | 127 | 52% | 5% | 31% | 13% | 1.838 | 2.712 | 1.550 | +1.162 |
| Bedggood, Melissa* | 126 | 44% | 3% | 11% | 41% | 2.324 | 3.284 | 1.014 | +2.270 |
| Morritt, Tracey* | 115 | 40% | 3% | 11% | 45% | 2.254 | 2.762 | 0.841 | +1.921 |
| Mills, Steven* | 109 | 55% | 6% | 24% | 15% | 2.011 | 3.011 | 1.462 | +1.548 |
| Spence, Dion* | 103 | 46% | 5% | 17% | 33% | 2.116 | 3.130 | 1.884 | +1.246 |
| Govan, Kim* | 96 | 33% | 3% | 9% | 54% | 2.250 | 2.455 | 0.727 | +1.727 |
| MacKinnon, Andrew* | 94 | 50% | 9% | 24% | 17% | 1.910 | 2.936 | 2.141 | +0.795 |
| Lawrence, Glenn* | 85 | 52% | 13% | 35% | 1.682 | 2.635 | 1.612 | +1.024 | |
| Kovarik, Hans* | 82 | 52% | 7% | 40% | 1.646 | 2.720 | 1.634 | +1.085 | |
| Shadbolt, Ron* | 75 | 53% | 7% | 40% | 1.667 | 2.800 | 1.720 | +1.080 | |
| Lawrence, Tony* | 70 | 51% | 9% | 40% | 1.629 | 3.386 | 2.243 | +1.143 | |
| Hill, Andrew | 57 | 54% | 5% | 12% | 28% | 2.341 | 2.610 | 0.732 | +1.878 |
| Granville, Alan* | 57 | 47% | 16% | 37% | 1.579 | 2.404 | 1.737 | +0.667 | |
| Morritt, Sharon* | 54 | 72% | 6% | 22% | 2.222 | 3.352 | 1.833 | +1.519 | |
| Trudgen, Brendan | 51 | 57% | 6% | 6% | 31% | 2.571 | 3.143 | 0.514 | +2.629 |
| Downs, David* | 49 | 51% | 16% | 33% | 1.694 | 3.082 | 2.020 | +1.061 | |
| Irvine, Andrew* | 44 | 36% | 9% | 55% | 1.182 | 2.636 | 2.568 | +0.068 | |
| Bluschke, Alf* | 44 | 64% | 11% | 25% | 2.023 | 3.455 | 1.386 | +2.068 | |
| MacKinnon, Tim* | 41 | 49% | 15% | 37% | 1.610 | 3.732 | 3.415 | +0.317 | |
| Morenhart, Darren | 39 | 3% | 5% | 92% | 1.000 | 0.333 | 0.667 | -0.333 | |
| Rogers, Mark | 39 | 3% | 5% | 92% | 1.000 | 0.333 | 0.667 | -0.333 | |
| Weeks, Cameron | 39 | 3% | 5% | 92% | 1.000 | 0.333 | 0.667 | -0.333 | |
| Remedios, Lynette* | 37 | 35% | 5% | 16% | 43% | 1.952 | 2.619 | 1.143 | +1.476 |
| Lawrence, Richard* | 34 | 26% | 9% | 65% | 0.882 | 1.441 | 2.471 | -1.029 | |
| McNair, David* | 32 | 75% | 9% | 16% | 2.344 | 4.156 | 1.719 | +2.438 | |
| Cameron, John* | 29 | 62% | 14% | 24% | 2.000 | 2.966 | 0.966 | +2.000 | |
| Lawrence, William* | 28 | 36% | 11% | 54% | 1.179 | 2.536 | 2.536 | +0.000 | |
| Lawrence, Geoffrey* | 28 | 39% | 11% | 50% | 1.286 | 2.286 | 2.143 | +0.143 | |
| Self, Ryan* | 25 | 72% | 8% | 20% | 2.240 | 3.360 | 0.880 | +2.480 | |
| Garner, Troy | 24 | 63% | 13% | 25% | 2.000 | 5.250 | 2.500 | +2.750 | |
| Lawrence, Daryl* | 22 | 36% | 18% | 45% | 1.273 | 3.182 | 2.864 | +0.318 | |
| MacKinnon, Robert* | 22 | 82% | 5% | 14% | 2.500 | 5.227 | 1.364 | +3.864 | |
| Darcy, Astin* | 22 | 73% | 14% | 14% | 2.318 | 4.955 | 1.636 | +3.318 | |
| Powderly, Darryl* | 21 | 29% | 14% | 57% | 1.000 | 2.381 | 3.810 | -1.429 | |
| Arnold, Andrew* | 21 | 76% | 10% | 14% | 2.381 | 4.619 | 1.524 | +3.095 | |
| Kinniburgh, Melissa | 20 | 5% | 5% | 90% | 1.500 | 0.500 | 1.000 | -0.500 | |
| Kinniburgh, Penny | 20 | 5% | 5% | 90% | 1.500 | 0.500 | 1.000 | -0.500 | |
| O`Brien, Prue* | 20 | 5% | 5% | 90% | 1.500 | 0.500 | 1.000 | -0.500 | |
| Rogers, Lindy | 20 | 5% | 5% | 90% | 1.500 | 0.500 | 1.000 | -0.500 | |
| Wilson, Corey* | 20 | 90% | 5% | 5% | 2.750 | 2.600 | 0.300 | +2.300 | |
| Sorensen, Steven* | 20 | 50% | 30% | 20% | 1.800 | 2.200 | 1.550 | +0.650 | |
| Jurey, Carolyn | 19 | 5% | 95% | 0.000 | 0.000 | 0.000 | +0.000 | ||
| Bedggood, Stephen* | 19 | 42% | 5% | 53% | 1.316 | 2.474 | 4.579 | -2.105 | |
| Harris, Justin | 19 | 16% | 16% | 68% | 0.632 | 1.053 | 3.474 | -2.421 | |
| Taylor, Leigh | 18 | 83% | 6% | 11% | 2.556 | 3.778 | 0.833 | +2.944 | |
| Brazil, Sean* | 18 | 44% | 33% | 22% | 1.667 | 2.111 | 1.611 | +0.500 | |
| Stanyer, Adrian* | 18 | 44% | 33% | 22% | 1.667 | 2.111 | 1.611 | +0.500 | |
| Downs, Andrew* | 18 | 72% | 11% | 17% | 2.278 | 3.111 | 0.833 | +2.278 | |
| Slocombe, Morgan* | 17 | 47% | 29% | 24% | 1.706 | 2.824 | 1.706 | +1.118 | |
| Rihs, Daniel* | 17 | 41% | 35% | 24% | 1.588 | 2.176 | 1.706 | +0.471 | |
| Williams, Nigel* | 16 | 38% | 63% | 1.125 | 1.500 | 1.813 | -0.313 | ||
| Crebbin, Jason* | 16 | 44% | 31% | 25% | 1.625 | 2.188 | 1.688 | +0.500 | |
| Arnold, David* | 16 | 69% | 31% | 2.063 | 3.625 | 0.875 | +2.750 | ||
| Greed, Justin* | 16 | 69% | 13% | 19% | 2.188 | 3.813 | 0.813 | +3.000 | |
| Arnold, Chris* | 15 | 40% | 33% | 27% | 1.533 | 1.600 | 1.533 | +0.067 | |
| Jennings, Ian* | 15 | 53% | 33% | 13% | 1.933 | 2.267 | 1.400 | +0.867 | |
| Montgomery, John | 13 | 46% | 54% | 1.385 | 1.615 | 1.769 | -0.154 | ||
| Remedios, Colin* | 13 | 46% | 54% | 1.385 | 1.615 | 1.769 | -0.154 | ||
| Govan, Jeff* | 13 | 69% | 31% | 2.077 | 4.077 | 1.846 | +2.231 | ||
| Morritt, Earl* | 13 | 15% | 23% | 62% | 0.692 | 1.923 | 3.615 | -1.692 | |
| Dempsey, Michael* | 13 | 69% | 8% | 23% | 2.154 | 4.846 | 1.923 | +2.923 | |
| Bailey, Shane* | 12 | 25% | 25% | 50% | 1.000 | 2.000 | 3.083 | -1.083 | |
| Lewis, Chris* | 12 | 17% | 25% | 58% | 0.750 | 1.750 | 3.167 | -1.417 | |
| Noonan, Kristian* | 12 | 75% | 8% | 17% | 2.333 | 4.000 | 0.583 | +3.417 | |
| Baker, Daniel* | 12 | 58% | 25% | 17% | 2.000 | 2.500 | 0.833 | +1.667 | |
| Mumford, Matthew* | 12 | 58% | 25% | 17% | 2.000 | 2.500 | 0.833 | +1.667 | |
| Darcy, Thurston* | 11 | 73% | 9% | 18% | 2.273 | 5.000 | 1.636 | +3.364 | |
| Gilham, Mark* | 11 | 64% | 9% | 27% | 2.000 | 4.364 | 2.000 | +2.364 | |
| Goodwin, Leigh* | 11 | 82% | 18% | 2.455 | 4.364 | 0.818 | +3.545 | ||
| Cowland, Dean* | 10 | 30% | 10% | 60% | 1.000 | 1.600 | 1.800 | -0.200 | |
| Hanley-Wood, Ben* | 10 | 50% | 50% | 1.500 | 3.900 | 2.800 | +1.100 | ||
| Hocking, Branton* | 10 | 80% | 20% | 2.400 | 4.100 | 0.800 | +3.300 | ||
| Baker, Gavin* | 10 | 70% | 10% | 20% | 2.200 | 2.700 | 0.700 | +2.000 | |
| McIntyre, Jamie* | 9 | 56% | 11% | 33% | 1.778 | 3.222 | 1.444 | +1.778 | |
| McNair, Anthony* | 9 | 33% | 33% | 33% | 1.333 | 3.667 | 3.889 | -0.222 | |
| May, Adrian* | 9 | 56% | 11% | 33% | 1.778 | 4.889 | 2.111 | +2.778 | |
| Bauer, Andrew* | 8 | 13% | 13% | 75% | 0.500 | 1.250 | 7.750 | -6.500 | |
| Bugg, Travis | 8 | 13% | 13% | 75% | 0.500 | 1.250 | 7.750 | -6.500 | |
| Spence, Matthew* | 8 | 13% | 13% | 75% | 0.500 | 1.250 | 7.750 | -6.500 | |
| Tucker, David | 8 | 25% | 13% | 63% | 0.875 | 1.125 | 3.125 | -2.000 | |
| Treganowan, Jason | 7 | 29% | 71% | 0.286 | 1.000 | 3.857 | -2.857 | ||
| McLaren, Scott* | 7 | 29% | 29% | 43% | 1.143 | 2.000 | 1.857 | +0.143 | |
| Wruss, Steven | 6 | 17% | 17% | 67% | 0.667 | 2.000 | 1.833 | +0.167 | |
| Cook, Stuart* | 6 | 100% | 3.000 | 5.833 | 1.000 | +4.833 | |||
| Rodrigues, Errol* | 6 | 33% | 17% | 50% | 1.167 | 2.000 | 1.500 | +0.500 | |
| Childs, Scott* | 5 | 20% | 20% | 60% | 0.800 | 3.000 | 2.600 | +0.400 | |
| Powderly, Phillip* | 5 | 60% | 40% | 0.600 | 3.000 | 4.000 | -1.000 | ||
| Matthews, Ben* | 5 | 40% | 20% | 40% | 1.400 | 2.000 | 1.000 | +1.000 | |
| Armitage, Rohan* | 5 | 40% | 60% | 1.200 | 2.000 | 1.400 | +0.600 | ||
| Taylor, Derek | 4 | 25% | 75% | 0.750 | 0.500 | 2.750 | -2.250 | ||
| Nicholls, James | 4 | 50% | 25% | 25% | 1.750 | 4.250 | 2.500 | +1.750 | |
| Falcao, Hip* | 4 | 100% | 3.000 | 6.750 | 0.750 | +6.000 | |||
| Holahan, Zac* | 4 | 25% | 25% | 50% | 1.000 | 1.000 | 1.250 | -0.250 | |
| Allen, Mark* | 4 | 50% | 50% | 1.500 | 2.500 | 1.500 | +1.000 | ||
| Bonnici, Brad* | 4 | 50% | 50% | 1.500 | 2.500 | 1.000 | +1.500 | ||
| Fallowfield, Shelly* | 4 | 50% | 50% | 1.500 | 2.000 | 1.000 | +1.000 | ||
| Hart, Jack* | 4 | 50% | 50% | 1.500 | 2.500 | 1.500 | +1.000 | ||
| Iosua, Rachael* | 4 | 50% | 50% | 1.500 | 2.500 | 1.500 | +1.000 | ||
| James, Jeff* | 4 | 50% | 50% | 1.500 | 2.500 | 1.500 | +1.000 | ||
| Armstrong, Adam | 3 | 33% | 67% | 1.000 | 2.000 | 2.333 | -0.333 | ||
| Downs, Colleen* | 3 | 33% | 67% | 1.000 | 2.000 | 3.333 | -1.333 | ||
| Hoole, Carol* | 3 | 67% | 33% | 2.000 | 4.667 | 1.333 | +3.333 | ||
| Cautley, Mark* | 3 | 100% | 3.000 | 9.667 | 1.333 | +8.333 | |||
| Strobel, Joshua* | 3 | 67% | 33% | 2.000 | 4.333 | 4.667 | -0.333 | ||
| Brown, Chris* | 3 | 67% | 33% | 2.000 | 3.333 | 1.000 | +2.333 | ||
| Jones, Adrian | 2 | 50% | 50% | 1.500 | 1.500 | 1.500 | +0.000 | ||
| Cowland, Jason* | 2 | 50% | 50% | 2.000 | 2.000 | 1.500 | +0.500 | ||
| Bourke, Karen* | 2 | 100% | 0.000 | 1.000 | 3.000 | -2.000 | |||
| Morritt, Sandra* | 2 | 100% | 0.000 | 1.000 | 3.000 | -2.000 | |||
| Dine, Brenton* | 2 | 100% | 3.000 | 4.000 | 0.500 | +3.500 | |||
| Clough, Jarryd* | 2 | 50% | 50% | 0.500 | 2.000 | 5.500 | -3.500 | ||
| Bell, Ray* | 2 | 50% | 50% | 0.500 | 1.500 | 5.000 | -3.500 | ||
| Simpson, Matthew* | 2 | 100% | 0.000 | 0.000 | 2.000 | -2.000 | |||
| Book, Paul* | 1 | 100% | 3.000 | 2.000 | 1.000 | +1.000 | |||
| Millard, Chris | 1 | 100% | 3.000 | 2.000 | 1.000 | +1.000 | |||
| Downes, Cheryl* | 1 | 100% | 0.000 | 2.000 | 4.000 | -2.000 | |||
| Irvine, Suzanne* | 1 | 100% | 0.000 | 1.000 | 2.000 | -1.000 | |||
| Mills, Helen* | 1 | 100% | 0.000 | 2.000 | 6.000 | -4.000 | |||
| Mitchell, Sam | 1 | 100% | 1.000 | 7.000 | 7.000 | +0.000 | |||
| Blake, Alex* | 1 | 100% | 3.000 | 4.000 | 2.000 | +2.000 | |||
| Inkster, Janelle | 1 | 100% | 3.000 | 8.000 | 1.000 | +7.000 | |||
| McNair, Ann* | 1 | 100% | 0.000 | 2.000 | 6.000 | -4.000 | |||
| Calleja, Chris | 1 | 100% | 3.000 | 8.000 | 0.000 | +8.000 | |||
| Graetz, Jeff* | 1 | 100% | 3.000 | 3.000 | 2.000 | +1.000 | |||
| Cook, Lorraine* | 1 | 100% | 3.000 | 8.000 | 4.000 | +4.000 | |||
| Spence, Adam* | 1 | 100% | 3.000 | 12.000 | 0.000 | +12.000 | |||
| Haycock, John* | 1 | 100% | 1.000 | 1.000 | 1.000 | +0.000 | |||
| Thomas, Joshua* | 1 | 100% | 1.000 | 1.000 | 1.000 | +0.000 | |||
| Anderson, Matthew* | 1 | 100% | 0.000 | 2.000 | 9.000 | -7.000 | |||
| Hoad, Simon* | 1 | 100% | 0.000 | 2.000 | 9.000 | -7.000 | |||
| Hobbs, Neil* | 1 | 100% | 0.000 | 2.000 | 9.000 | -7.000 | |||
| Hooley, Aidan* | 1 | 100% | 0.000 | 2.000 | 9.000 | -7.000 | |||
| Hooley, Ryan* | 1 | 100% | 0.000 | 2.000 | 9.000 | -7.000 | |||
| Kelly, Bo* | 1 | 100% | 0.000 | 2.000 | 9.000 | -7.000 | |||
| McMurrie, Andrew* | 1 | 100% | 0.000 | 2.000 | 9.000 | -7.000 | |||
| McMurrie, Tom* | 1 | 100% | 0.000 | 2.000 | 9.000 | -7.000 | |||
| Armitage, Timothy* | 1 | 100% | 3.000 | 4.000 | 0.000 | +4.000 | |||
| Bairstow, Michael* | 1 | 100% | 3.000 | 4.000 | 0.000 | +4.000 | |||
| Bonnici, Samuel* | 1 | 100% | 3.000 | 4.000 | 0.000 | +4.000 | |||
| Brown, Daniel* | 1 | 100% | 3.000 | 4.000 | 0.000 | +4.000 | |||
| Haddy, Stephen* | 1 | 100% | 3.000 | 4.000 | 0.000 | +4.000 | |||
| Haddy, Thomas* | 1 | 100% | 3.000 | 4.000 | 0.000 | +4.000 | |||
| MacKenzie, Darren* | 1 | 100% | 3.000 | 4.000 | 0.000 | +4.000 | |||
| Naseer, Rizwan* | 1 | 100% | 3.000 | 4.000 | 0.000 | +4.000 | |||
| Wilson, Christopher* | 1 | 100% | 3.000 | 4.000 | 0.000 | +4.000 |
Opposition Teams
| Opponent |
Games |
Goals | Avge |
Win % | Draw % | Loss % | Unkn % | Avge. Points |
Avge. For | Avge. Aga | Avge. Diff. |
G.K. Games | Shut- outs | Shut- out % | Goals In | Goals Avge |
|---|---|---|---|---|---|---|---|---|---|---|---|---|---|---|---|---|
| Not Recorded | 54 | 4% | 96% | 3.000 | 0.000 | 0.000 | +0.000 | |||||||||
| MUHC | 18 | 12 | 0.667 | 83% | 6% | 11% | 2.556 | 4.333 | 1.056 | +3.278 | ||||||
| Altona | 15 | 8 | 0.533 | 47% | 13% | 40% | 1.533 | 2.267 | 1.800 | +0.467 | ||||||
| Essendon | 14 | 7 | 0.500 | 79% | 21% | 2.357 | 2.857 | 1.143 | +1.714 | |||||||
| Footscray | 14 | 4 | 0.286 | 50% | 7% | 43% | 1.571 | 2.714 | 1.571 | +1.143 | ||||||
| Brunswick | 13 | 7 | 0.538 | 62% | 38% | 1.846 | 2.923 | 3.769 | -0.846 | |||||||
| Camberwell | 12 | 5 | 0.417 | 42% | 8% | 50% | 1.333 | 2.167 | 2.417 | -0.250 | ||||||
| PEGS | 12 | 2 | 0.167 | 17% | 33% | 50% | 0.833 | 1.917 | 2.417 | -0.500 | ||||||
| RMIT | 12 | 3 | 0.250 | 58% | 42% | 1.750 | 3.750 | 2.000 | +1.750 | |||||||
| Greensborough | 11 | 7 | 0.636 | 73% | 9% | 18% | 2.273 | 4.182 | 1.091 | +3.091 | ||||||
| Kew | 10 | 9 | 0.900 | 70% | 20% | 10% | 2.300 | 3.400 | 0.700 | +2.700 | ||||||
| Powerhouse | 10 | 1 | 0.100 | 30% | 70% | 0.900 | 1.200 | 2.100 | -0.900 | |||||||
| MHSOB | 10 | 11 | 1.100 | 60% | 20% | 20% | 2.000 | 4.700 | 1.800 | +2.900 | ||||||
| Werribee | 8 | 5 | 0.625 | 63% | 13% | 25% | 2.000 | 3.250 | 2.875 | +0.375 | ||||||
| Doncaster | 7 | 2 | 0.286 | 86% | 14% | 2.571 | 2.857 | 1.286 | +1.571 | |||||||
| Old Melburnians | 6 | 1 | 0.167 | 33% | 67% | 1.000 | 2.333 | 2.500 | -0.167 | |||||||
| MCC | 5 | 2 | 0.400 | 40% | 60% | 1.200 | 1.200 | 2.200 | -1.000 | |||||||
| Kealba | 4 | 1 | 0.250 | 100% | 3.000 | 4.000 | 0.250 | +3.750 | ||||||||
| Collegians-X | 4 | 50% | 50% | 0.500 | 1.000 | 2.500 | -1.500 | |||||||||
| Yarra Valley | 3 | 2 | 0.667 | 100% | 3.000 | 7.333 | 0.000 | +7.333 | ||||||||
| Box Hill | 3 | 33% | 67% | 1.000 | 0.667 | 2.333 | -1.667 | |||||||||
| St.Bedes | 3 | 33% | 67% | 1.000 | 1.667 | 2.333 | -0.667 | |||||||||
| South Barwon | 2 | 50% | 50% | 1.500 | 0.500 | 3.000 | -2.500 | |||||||||
| Strathmore Park | 2 | 100% | 0.000 | 1.500 | 3.000 | -1.500 | ||||||||||
| Bendigo | 2 | 1 | 0.500 | 50% | 50% | 0.500 | 2.000 | 4.500 | -2.500 | |||||||
| Hawthorn | 2 | 1 | 0.500 | 100% | 3.000 | 8.500 | 2.000 | +6.500 | ||||||||
| Ajax-Maccabi | 2 | 100% | 3.000 | 5.500 | 0.500 | +5.000 | ||||||||||
| Old Yarra | 2 | 100% | 3.000 | 3.000 | 0.500 | +2.500 | ||||||||||
| Trinity | 2 | 100% | 3.000 | 3.000 | 2.000 | +1.000 | ||||||||||
| Swinburne | 2 | 1 | 0.500 | 50% | 50% | 2.000 | 2.500 | 1.000 | +1.500 | |||||||
| Baw-Baw | 2 | 50% | 50% | 1.500 | 0.500 | 0.500 | +0.000 | |||||||||
| Elsternwick | 1 | 100% | 3.000 | 9.000 | 0.000 | +9.000 | ||||||||||
| Grail | 1 | 1 | 1.000 | 100% | 0.000 | 1.000 | 7.000 | -6.000 | ||||||||
| Mentone | 1 | 100% | 0.000 | 0.000 | 7.000 | -7.000 | ||||||||||
| Geelong | 1 | 1 | 1.000 | 100% | 1.000 | 3.000 | 3.000 | +0.000 | ||||||||
| Goulburn Valley | 1 | 100% | 0.000 | 0.000 | 5.000 | -5.000 | ||||||||||
| CBCOC | 1 | 100% | 1.000 | 1.000 | 1.000 | +0.000 | ||||||||||
| Mornington | 1 | 100% | 1.000 | 1.000 | 1.000 | +0.000 | ||||||||||
| Marcellin | 1 | 100% | 3.000 | 6.000 | 2.000 | +4.000 | ||||||||||
| Sth. Knights | 1 | 100% | 1.000 | 3.000 | 3.000 | +0.000 | ||||||||||
| Ballarat | 1 | 100% | 0.000 | 2.000 | 5.000 | -3.000 | ||||||||||
| Eastern | 1 | 100% | 1.000 | 1.000 | 1.000 | +0.000 | ||||||||||
| Hume | 1 | 100% | 3.000 | 4.000 | 0.000 | +4.000 | ||||||||||
| Opponents :43 | 278 | 94 | 0.338 | 45% | 9% | 27% | 19% | 1.779 | 2.925 | 1.881 | +1.044 |
Playing Venues
| Venue | Games |
Goals | Avge. |
Win % | Draw % | Loss % | Unkn % | Avge. Points |
Avge. For | Avge. Aga | Avge. Diff. |
G.K. Games | Shut- outs | Shut- out % | Goals In | Goals Avge. |
|---|---|---|---|---|---|---|---|---|---|---|---|---|---|---|---|---|
| Not Recorded | 95 | 29 | 0.305 | 34% | 3% | 8% | 55% | 2.302 | 2.488 | 0.651 | +1.837 | |||||
| Melton Mowbray | 36 | 12 | 0.333 | 72% | 11% | 17% | 2.278 | 4.083 | 1.444 | +2.639 | ||||||
| Altona | 30 | 17 | 0.567 | 40% | 23% | 37% | 1.433 | 2.567 | 2.500 | +0.067 | ||||||
| Essendon | 19 | 5 | 0.263 | 63% | 37% | 1.895 | 3.053 | 1.579 | +1.474 | |||||||
| PEGS | 14 | 5 | 0.357 | 29% | 36% | 36% | 1.214 | 2.286 | 1.929 | +0.357 | ||||||
| Footscray | 12 | 3 | 0.250 | 33% | 8% | 58% | 1.083 | 2.500 | 2.167 | +0.333 | ||||||
| Essendon Indoor | 8 | 13% | 13% | 75% | 0.500 | 1.250 | 7.750 | -6.500 | ||||||||
| Olympic Park | 5 | 3 | 0.600 | 40% | 60% | 1.200 | 2.400 | 1.400 | +1.000 | |||||||
| Camberwell | 4 | 25% | 75% | 0.750 | 1.000 | 2.750 | -1.750 | |||||||||
| Hawthorn | 4 | 2 | 0.500 | 25% | 25% | 50% | 1.000 | 2.000 | 2.250 | -0.250 | ||||||
| Doncaster | 4 | 75% | 25% | 2.250 | 2.500 | 1.750 | +0.750 | |||||||||
| SHC | 4 | 1 | 0.250 | 25% | 75% | 0.750 | 2.500 | 3.500 | -1.000 | |||||||
| Melton | 4 | 1 | 0.250 | 75% | 25% | 2.250 | 3.000 | 0.250 | +2.750 | |||||||
| Yarra Velodrome | 3 | 3 | 1.000 | 67% | 33% | 2.000 | 5.667 | 0.667 | +5.000 | |||||||
| Reservoir | 3 | 5 | 1.667 | 100% | 3.000 | 7.000 | 1.000 | +6.000 | ||||||||
| Waverley | 3 | 33% | 33% | 33% | 1.333 | 2.667 | 3.000 | -0.333 | ||||||||
| Melbourne Uni | 3 | 3 | 1.000 | 100% | 3.000 | 7.333 | 0.333 | +7.000 | ||||||||
| Melbourne High | 3 | 67% | 33% | 2.000 | 3.333 | 2.667 | +0.667 | |||||||||
| Albert Park-G | 2 | 50% | 50% | 1.500 | 1.500 | 2.000 | -0.500 | |||||||||
| Geelong | 2 | 50% | 50% | 1.500 | 0.500 | 3.000 | -2.500 | |||||||||
| Elgar Park | 2 | 50% | 50% | 0.500 | 4.000 | 5.000 | -1.000 | |||||||||
| Albert Park | 2 | 50% | 50% | 1.500 | 2.000 | 2.000 | +0.000 | |||||||||
| Greensborough | 2 | 2 | 1.000 | 100% | 3.000 | 5.500 | 1.000 | +4.500 | ||||||||
| Werribee | 2 | 2 | 1.000 | 100% | 3.000 | 3.500 | 0.500 | +3.000 | ||||||||
| Melb Grammar | 2 | 100% | 0.000 | 0.500 | 3.000 | -2.500 | ||||||||||
| Melton-G | 1 | 1 | 1.000 | 100% | 3.000 | 2.000 | 1.000 | +1.000 | ||||||||
| Kealba | 1 | 100% | 3.000 | 1.000 | 0.000 | +1.000 | ||||||||||
| Wesley College | 1 | 100% | 0.000 | 0.000 | 2.000 | -2.000 | ||||||||||
| Dandenong | 1 | 100% | 3.000 | 9.000 | 0.000 | +9.000 | ||||||||||
| Shepparton | 1 | 100% | 0.000 | 0.000 | 5.000 | -5.000 | ||||||||||
| Scotch College | 1 | 100% | 3.000 | 10.000 | 4.000 | +6.000 | ||||||||||
| Mentone | 1 | 100% | 3.000 | 3.000 | 1.000 | +2.000 | ||||||||||
| Trinity | 1 | 100% | 3.000 | 4.000 | 3.000 | +1.000 | ||||||||||
| Monash | 1 | 100% | 0.000 | 0.000 | 1.000 | -1.000 | ||||||||||
| PSF | 1 | 100% | 0.000 | 2.000 | 3.000 | -1.000 | ||||||||||
| Venues :35 | 278 | 94 | 0.338 | 45% | 9% | 27% | 19% | 1.779 | 2.925 | 1.881 | +1.044 |