 |
Melton Hockey Club |
|
Last updated : 11:05 am - 2 November 2023
Club Cap : 451
(Games : 221, Goals : 6 )
First XI Men's Cap : 93
(Games : 167, Goals : 0)
Games Umpired : 70
(Senior : 20, Veteran : 19, Junior : 31)
Milestones
| 1999-Apr-23 : | First Junior game (Melton 0 drew Footscray 0. R-02: 1999 U15 North) |
| 1999-Apr-23 : | First game (Melton 0 drew Footscray 0. R-02: 1999 U15 North) |
| 2000-Apr-01 : | First First XI Mens game (Corio 4 def. Melton 1. R-02: 2000 State League 4 Men) |
| 2000-Apr-07 : | Last Junior game (Kew 21 def. Melton 0. R-02: 2000 U17 North) |
| 2001-Feb-13 : | First goal scored (Melton 2 drew Brunswick (B) 2. R-10: 2000/01 Footscray Tues. Men) |
| 2001-Jul-22 : | First Game umpired |
| 2009-Jun-26 : | Last game umpired (Footscray (B) 3 def. Melton 1. R-10: 2009 U13 West) |
| 2013-May-04 : | Last First XI Mens game played (Melton 2 drew Swinburne 2. R-04: 2013 Vic League 3 Men) |
| 2013-May-11 : | Last Senior game (Werribee (B) 2 def. Melton 1. R-05: 2013 Metro 3 West (B)) |
| 2013-May-11 : | Last game played (Werribee (B) 2 def. Melton 1. R-05: 2013 Metro 3 West (B)) |
| Playing career : 5132 days. (14 years and 22 days.) |
Honours, Trophies, and Official Roles
| Board Member : | 2001/02, 2008/09 |
| Press Secretary : | 2001/02 |
| Outstanding Junior : | 1998/99 |
| Junior Sportsmanship : | 1999/00 |
| Club Champion (Men) : | 2000/01 |
| Top Male Scorer (Sum.) : | 2002/03 |
| Best and Fairest : | 2001-State League 4 Men |
| B&F Runner Up : | 1999-U15 North, 2004-State League 4 Men |
| Coach's Award : | 2000-State League 4 Men, 2001-State League 4 Men |
| Manager : | 2008-U15 Pennant North |
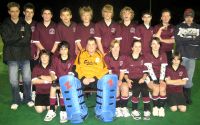
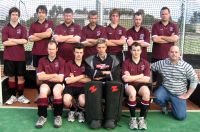
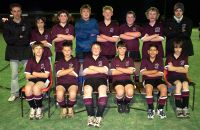
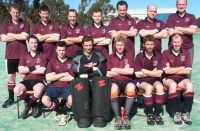
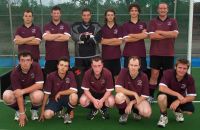
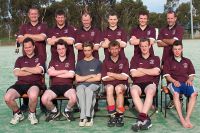
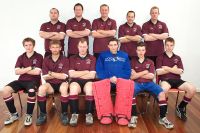
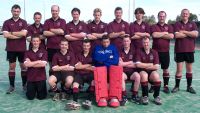
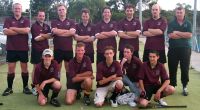
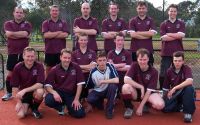
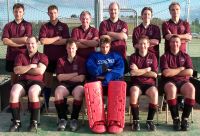
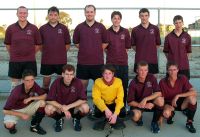
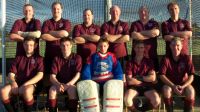
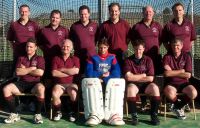
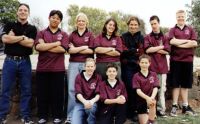
Team Photographs
Complete Playing History
Teams played with : 21
Premierships won : 0
Wooden Spoons : 3
| Games as Player |
Games Won | Games Drawn | Games Lost | Total | Goals | Goalscoring Average |
|---|---|---|---|---|---|---|
| Junior Winter | 0 | 3 | 14 | 17 | 0 | 0.000 |
| Senior Winter | 66 | 27 | 78 | 171 | 0 | 0.000 |
| Senior Summer | 10 | 7 | 16 | 33 | 6 | 0.400 |
| Senior Total | 76 | 34 | 94 | 204 | 6 | 0.400 |
| Total | 76 | 37 | 108 | 221 | 6 | 0.400 |
| Pos. | PR/WS | Div. | Competition | Games | Goals | Avge. | Won | Drawn | Lost | Avge.For | Avge.Aga | Avge.Diff | G.For | G.Aga | GoalDiff |
|---|---|---|---|---|---|---|---|---|---|---|---|---|---|---|---|
| 6 | 2013 Vic League 3 Men* | 4 | 1 | 2 | 1 | 1.750 | 1.750 | +0.000 | 7 | 7 | +000 | ||||
| 5 | 2013 Metro 3 West (B)* | 1 | 1 | 1.000 | 2.000 | -1.000 | 1 | 2 | -001 | ||||||
| 7 | 2010 Metro 3 West Men* | 2 | 1 | 1 | 1.500 | 2.000 | -0.500 | 3 | 4 | -001 | |||||
| 2 | 2009 Metro 2 West Men* | 1 | 1 | 4.000 | 1.000 | +3.000 | 4 | 1 | +003 | ||||||
| 5 | 2008 State League 4 Men* | 18 | 8 | 3 | 7 | 2.889 | 3.500 | -0.611 | 52 | 63 | -011 | ||||
| 5 | 2007 State League 4 Men* | 18 | 8 | 4 | 6 | 2.722 | 2.778 | -0.056 | 49 | 50 | -001 | ||||
| 6 | WS | 2006/07 Footscray Tues. Men* | 8 | 2 | 2 | 4 | 1.875 | 1.875 | +0.000 | 15 | 15 | +000 | |||
| 9 | 2006 State League 4 Men* | 18 | 4 | 3 | 11 | 2.000 | 3.056 | -1.056 | 36 | 55 | -019 | ||||
| 4 | 2005/06 Footscray Tues. A Men* | 1 | 1 | 2.000 | 1.000 | +1.000 | 2 | 1 | +001 | ||||||
| 2 | 2005 State League 5 Men* | 21 | 16 | 2 | 3 | 3.667 | 1.571 | +2.095 | 77 | 33 | +044 | ||||
| 9 | 2004 State League 4 Men* | 18 | 3 | 3 | 12 | 1.944 | 3.333 | -1.389 | 35 | 60 | -025 | ||||
| 4 | 2003/04 Footscray Tues. Men* | 4 | 3 | 1.000 | 2 | 2 | 2.500 | 2.250 | +0.250 | 10 | 9 | +001 | |||
| 3 | 2003 State League 5 Men* | 18 | 10 | 4 | 4 | 2.056 | 1.389 | +0.667 | 37 | 25 | +012 | ||||
| 5 | 2002/03 Footscray Tue. Men* | 3 | 2 | 0.667 | 1 | 2 | 2.667 | 2.333 | +0.333 | 8 | 7 | +001 | |||
| 5 | 2002 State League 5 Men* | 17 | 8 | 2 | 7 | 1.882 | 1.882 | +0.000 | 32 | 32 | +000 | ||||
| 7 | 2001/02 Footscray Tues. Men* | 9 | 2 | 3 | 4 | 1.222 | 1.556 | -0.333 | 11 | 14 | -003 | ||||
| 9 | 2001 State League 4 Men* | 18 | 2 | 2 | 14 | 1.278 | 4.056 | -2.778 | 23 | 73 | -050 | ||||
| 4 | 2000/01 Footscray Tues. Men | 8 | 1 | 0.250 | 2 | 2 | 4 | 2.125 | 2.875 | -0.750 | 17 | 23 | -006 | ||
| 9 | 2000 State League 4 Men* | 17 | 5 | 1 | 11 | 1.882 | 4.176 | -2.294 | 32 | 71 | -039 | ||||
| -1 | WS | 2000 U17 North | 2 | 2 | 0.000 | 18.500 | -18.500 | 0 | 37 | -037 | |||||
| 9 | WS | 1999 U15 North* | 15 | 3 | 12 | 0.400 | 4.600 | -4.200 | 6 | 69 | -063 | ||||
| 221 | 6 | 0.400 | 76 | 37 | 108 | 2.077 | 2.946 | -0.878 | 457 | 651 | -194 |
Goalkeeping History
| Games as Goalkeeper |
Games Won | Games Drawn | Games Lost | Total | Shut outs |
Shutout Average |
Goals Against |
G.A. Avg. |
|---|---|---|---|---|---|---|---|---|
| Junior Winter | 0 | 3 | 14 | 17 | 1 | 0.059 | 106 | 6.235 |
| Senior Winter | 66 | 27 | 78 | 171 | 15 | 0.088 | 476 | 2.784 |
| Senior Summer | 6 | 3 | 9 | 18 | 5 | 0.278 | 36 | 2.000 |
| Total | 72 | 33 | 101 | 206 | 21 | 0.102 | 618 | 3.000 |
| Pos. | Div. | Competition | Games | Won | Drawn | Lost | Shutouts | % | Goals In | Avge. | GoalDiff |
|---|---|---|---|---|---|---|---|---|---|---|---|
| 6 | 2013 Vic League 3 Men* | 4 | 1 | 2 | 1 | 1 | 25% | 7 | 1.750 | +000 | |
| 5 | 2013 Metro 3 West (B)* | 1 | 1 | 0% | 2 | 2.000 | -001 | ||||
| 7 | 2010 Metro 3 West Men* | 2 | 1 | 1 | 0% | 4 | 2.000 | -001 | |||
| 2 | 2009 Metro 2 West Men* | 1 | 1 | 0% | 1 | 1.000 | +003 | ||||
| 5 | 2008 State League 4 Men* | 18 | 8 | 3 | 7 | 1 | 6% | 63 | 3.500 | -011 | |
| 5 | 2007 State League 4 Men* | 18 | 8 | 4 | 6 | 1 | 6% | 50 | 2.778 | -001 | |
| 6 | 2006/07 Footscray Tues. Men* | 7 | 2 | 1 | 4 | 3 | 43% | 13 | 1.857 | +000 | |
| 9 | 2006 State League 4 Men* | 18 | 4 | 3 | 11 | 1 | 6% | 55 | 3.056 | -019 | |
| 4 | 2005/06 Footscray Tues. A Men* | 1 | 1 | 0% | 1 | 1.000 | +001 | ||||
| 2 | 2005 State League 5 Men* | 21 | 16 | 2 | 3 | 2 | 10% | 33 | 1.571 | +044 | |
| 9 | 2004 State League 4 Men* | 18 | 3 | 3 | 12 | 0% | 60 | 3.333 | -025 | ||
| 4 | 2003/04 Footscray Tues. Men* | 1 | 1 | 1 | 100% | 0.000 | +003 | ||||
| 3 | 2003 State League 5 Men* | 18 | 10 | 4 | 4 | 4 | 22% | 25 | 1.389 | +012 | |
| 5 | 2002 State League 5 Men* | 17 | 8 | 2 | 7 | 3 | 18% | 32 | 1.882 | +000 | |
| 7 | 2001/02 Footscray Tues. Men* | 5 | 1 | 1 | 3 | 1 | 20% | 9 | 1.800 | -002 | |
| 9 | 2001 State League 4 Men* | 18 | 2 | 2 | 14 | 2 | 11% | 73 | 4.056 | -050 | |
| 4 | 2000/01 Footscray Tues. Men | 4 | 1 | 1 | 2 | 0% | 13 | 3.250 | -005 | ||
| 9 | 2000 State League 4 Men* | 17 | 5 | 1 | 11 | 0% | 71 | 4.176 | -039 | ||
| -1 | 2000 U17 North | 2 | 2 | 0% | 37 | 18.500 | -037 | ||||
| 9 | 1999 U15 North* | 15 | 3 | 12 | 1 | 7% | 69 | 4.600 | -063 | ||
| 206 | 72 | 33 | 101 | 21 | 10% | 618 | 3.000 | -191 |
Umpiring History
Year    Division                      SEN VET JUN
2001    U15 North                               5
2001    District 3 North Women          1
2001    Club Commitments                1
2002    U17 North                              15
2002    Veterans D West                     3
2002    District 4 North Women          2
2002    Metro 4 West Men                4
2003    U17 Pennant North                       2
2003    Metro 4 West Men                2
2004    U17                                     2
2004    Veterans C West                     5
2004    District 4 North Women          1
2006    Metro 4 West Men                3
2006    Metro 3 West Men                1
2007    U13 Pennant North                       4
2007    Veterans E                          2
2007    Veterans C West                     9
2007    Metro 3 West Men                3
2008    U15 Pennant North                       2
2008    Metro 3 West Men                1
2009    U13 West                                1
2009    Metro 3 West Men                1

SUBTOTAL                               20  19  31
TOTAL                                          70
Junior Winter Playing History
| Games as Player |
Games Won | Games Drawn | Games Lost | Total | Goals | Goalscoring Average |
|---|---|---|---|---|---|---|
| Junior Winter | 0 | 3 | 14 | 17 | 0 | 0.000 |
| First Game : | Melton 0 drew Footscray 0. R-02: 1999 U15 North |
| Last Game : | Kew 21 def. Melton 0. R-02: 2000 U17 North |
| Best Win : | Melton 1 drew Yarra Valley 1. R-14: 1999 U15 North |
| Worst Loss : | Kew 21 def. Melton 0. R-02: 2000 U17 North |
| Finals : | None. |
| Premierships : | None. |
Senior Winter Playing History
| Games as Player |
Games Won | Games Drawn | Games Lost | Total | Goals | Goalscoring Average |
|---|---|---|---|---|---|---|
| Senior Winter | 66 | 27 | 78 | 171 | 0 | 0.000 |
| First Game : | Corio 4 def. Melton 1. R-02: 2000 State League 4 Men |
| Last Game : | Werribee (B) 2 def. Melton 1. R-05: 2013 Metro 3 West (B) |
| Best Win : | Melton 10 def. Marcellin 2. R-03: 2002 State League 5 Men |
| Worst Loss : | Casey 17 def. Melton 0. R-11: 2008 State League 4 Men |
| Finals : | Baw-Baw 1 def. Melton 0. PF: 2003 State League 5 Men St.Bedes 4 def. Melton 1. SF: 2003 State League 5 Men St.Bedes 4 def. Melton 2. GF: 2005 State League 5 Men Melton 3 def. Collegians-X 2. PF: 2005 State League 5 Men St.Bedes 1 def. Melton 0. SF: 2005 State League 5 Men |
| Premierships : | None. |
Senior Summer Playing History
| Games as Player |
Games Won | Games Drawn | Games Lost | Total | Goals | Goalscoring Average |
|---|---|---|---|---|---|---|
| Senior Summer | 10 | 7 | 16 | 33 | 6 | 0.400 |
| First Game : | RMIT 3 def. Melton 2. R-01: 2000/01 Footscray Tues. Men |
| Last Game : | Melton 8 def. Footscray (A) 0. R-10: 2006/07 Footscray Tues. Men |
| Best Win : | Melton 8 def. Footscray (A) 0. R-10: 2006/07 Footscray Tues. Men |
| Worst Loss : | Footscray (B) 6 def. Melton 1. R-01: 2006/07 Footscray Tues. Men |
| 1 goal games : | 3 times. Last : RMIT 4 def. Melton 3. R-03: 2002/03 Footscray Tue. Men |
| 3 goal games : | 1 times. Last : Melton 7 def. RMIT (A) 3. R-08: 2003/04 Footscray Tues. Men |
| Finals : | Brunswick (B) 3 def. Melton 2. CF: 2000/01 Footscray Tues. Men RMIT 7 def. Melton 2. SF: 2000/01 Footscray Tues. Men Melton 0 drew Brunswick (Black) 0. QF: 2001/02 Footscray Tues. Men |
| Premierships : | None. |
Teammates
Number of teammates :103
| Player |
Games |
Win % | Draw % | Loss % | Unkn % | Avge. Points |
Avge. For | Avge. Aga | Avge. Diff. |
|---|---|---|---|---|---|---|---|---|---|
| Sorensen, Steven* | 165 | 41% | 15% | 45% | 1.364 | 2.370 | 2.685 | -0.315 | |
| Downs, David* | 142 | 39% | 15% | 45% | 1.338 | 2.324 | 2.563 | -0.239 | |
| Arnold, Chris* | 139 | 36% | 19% | 45% | 1.266 | 2.173 | 2.986 | -0.813 | |
| Brazil, Sean* | 132 | 42% | 20% | 39% | 1.447 | 2.432 | 2.303 | +0.129 | |
| Lawrence, Glenn* | 123 | 40% | 15% | 45% | 1.350 | 2.260 | 2.780 | -0.520 | |
| Crebbin, Jason* | 102 | 30% | 16% | 54% | 1.069 | 1.745 | 2.735 | -0.990 | |
| Rihs, Daniel* | 97 | 45% | 18% | 37% | 1.536 | 2.495 | 2.330 | +0.165 | |
| Lawrence, Stephen* | 95 | 44% | 13% | 43% | 1.453 | 2.653 | 2.905 | -0.253 | |
| Arnold, Andrew* | 89 | 40% | 19% | 40% | 1.404 | 2.596 | 2.539 | +0.056 | |
| McLaren, Scott* | 89 | 45% | 17% | 38% | 1.517 | 2.775 | 2.629 | +0.146 | |
| Granville, Alan* | 86 | 34% | 14% | 52% | 1.151 | 1.872 | 2.581 | -0.709 | |
| Powderly, Phillip* | 79 | 39% | 16% | 44% | 1.342 | 2.557 | 2.684 | -0.127 | |
| Slocombe, Morgan* | 71 | 37% | 18% | 45% | 1.282 | 1.972 | 2.197 | -0.225 | |
| Kovarik, Hans* | 65 | 28% | 12% | 60% | 0.954 | 1.708 | 3.200 | -1.492 | |
| Hanley-Wood, Ben* | 65 | 37% | 20% | 43% | 1.308 | 2.385 | 2.785 | -0.400 | |
| Cameron, John* | 61 | 34% | 20% | 46% | 1.230 | 1.738 | 2.361 | -0.623 | |
| Shadbolt, Ron* | 52 | 29% | 12% | 60% | 0.981 | 1.673 | 3.462 | -1.788 | |
| Bluschke, Alf* | 50 | 34% | 12% | 54% | 1.140 | 1.920 | 2.620 | -0.700 | |
| Bedggood, Stephen* | 47 | 26% | 15% | 60% | 0.915 | 1.596 | 2.851 | -1.255 | |
| Noonan, Kristian* | 42 | 50% | 21% | 29% | 1.714 | 2.667 | 2.119 | +0.548 | |
| Jennings, Ian* | 40 | 48% | 18% | 35% | 1.600 | 1.925 | 1.900 | +0.025 | |
| Graetz, Jeff* | 37 | 19% | 14% | 68% | 0.703 | 1.649 | 3.514 | -1.865 | |
| Downs, Andrew* | 36 | 33% | 11% | 56% | 1.111 | 1.972 | 3.583 | -1.611 | |
| Darcy, Thurston* | 32 | 31% | 19% | 50% | 1.125 | 2.344 | 2.469 | -0.125 | |
| Lawrence, Daryl* | 28 | 43% | 7% | 50% | 1.357 | 2.393 | 3.679 | -1.286 | |
| Baker, Gavin* | 22 | 36% | 5% | 59% | 1.136 | 2.091 | 3.409 | -1.318 | |
| Williams, Mark* | 18 | 44% | 33% | 22% | 1.667 | 2.111 | 1.611 | +0.500 | |
| Freeman, Brent | 17 | 18% | 82% | 0.176 | 0.353 | 6.235 | -5.882 | ||
| Vinco, Herbert* | 17 | 18% | 82% | 0.176 | 0.353 | 6.235 | -5.882 | ||
| Pisani, Sandy* | 16 | 19% | 81% | 0.188 | 0.375 | 6.500 | -6.125 | ||
| Hosking, Michael* | 16 | 38% | 19% | 44% | 1.313 | 2.563 | 2.750 | -0.188 | |
| Lau, Derrick | 15 | 20% | 80% | 0.200 | 0.400 | 5.733 | -5.333 | ||
| Smakman, Luke* | 15 | 20% | 80% | 0.200 | 0.400 | 4.600 | -4.200 | ||
| Lawrence, Tony* | 14 | 43% | 14% | 43% | 1.429 | 2.429 | 3.571 | -1.143 | |
| O`Shae, Ryan* | 14 | 43% | 29% | 29% | 1.571 | 3.071 | 2.786 | +0.286 | |
| Treganowan, Brad* | 13 | 23% | 8% | 69% | 0.769 | 2.000 | 3.923 | -1.923 | |
| MacKinnon, Robert* | 13 | 46% | 8% | 46% | 1.462 | 2.077 | 4.385 | -2.308 | |
| Mills, Steven* | 13 | 31% | 23% | 46% | 1.154 | 1.615 | 1.769 | -0.154 | |
| Cautley, Mark* | 13 | 77% | 23% | 2.308 | 3.385 | 1.615 | +1.769 | ||
| Hawes, John* | 12 | 25% | 75% | 0.250 | 0.417 | 4.833 | -4.417 | ||
| Lawrence, William* | 12 | 25% | 17% | 58% | 0.917 | 1.917 | 3.083 | -1.167 | |
| Baker, Daniel* | 11 | 36% | 36% | 27% | 1.455 | 2.455 | 1.545 | +0.909 | |
| McLeod, Nicole* | 10 | 20% | 80% | 0.200 | 0.400 | 4.800 | -4.400 | ||
| York, Mitchell* | 10 | 10% | 30% | 60% | 0.600 | 1.000 | 2.400 | -1.400 | |
| Goodwin, Leigh* | 10 | 10% | 30% | 60% | 0.600 | 1.600 | 2.900 | -1.300 | |
| McNair, David* | 9 | 44% | 11% | 44% | 1.444 | 2.111 | 3.667 | -1.556 | |
| Duffy, Craig* | 9 | 22% | 33% | 44% | 1.000 | 1.222 | 1.556 | -0.333 | |
| Cook, Stuart* | 8 | 25% | 75% | 0.750 | 1.750 | 4.125 | -2.375 | ||
| May, Adrian* | 8 | 38% | 63% | 1.125 | 1.375 | 1.875 | -0.500 | ||
| Mumford, Matthew* | 8 | 38% | 25% | 38% | 1.375 | 2.250 | 1.875 | +0.375 | |
| Bluschke, Mark* | 7 | 29% | 14% | 57% | 1.000 | 2.143 | 3.000 | -0.857 | |
| Buttigieg, William* | 7 | 29% | 29% | 43% | 1.143 | 2.000 | 1.286 | +0.714 | |
| Matthews, Ben* | 7 | 29% | 29% | 43% | 1.143 | 2.429 | 2.286 | +0.143 | |
| O`Conner, Kristy* | 6 | 17% | 83% | 0.167 | 0.500 | 6.500 | -6.000 | ||
| Thomas, Joshua* | 6 | 50% | 50% | 1.500 | 2.833 | 4.500 | -1.667 | ||
| Ward, Michael | 5 | 20% | 80% | 0.200 | 0.200 | 7.200 | -7.000 | ||
| Kari, Grant* | 5 | 40% | 20% | 40% | 1.400 | 3.000 | 3.400 | -0.400 | |
| Mico, David* | 5 | 20% | 60% | 20% | 1.200 | 1.000 | 1.000 | +0.000 | |
| Darcy, Astin* | 5 | 40% | 60% | 1.200 | 2.200 | 2.000 | +0.200 | ||
| Holahan, Zac* | 5 | 40% | 20% | 40% | 1.400 | 3.200 | 2.400 | +0.800 | |
| Salvatore, Aaron* | 5 | 20% | 60% | 20% | 1.200 | 1.600 | 1.600 | +0.000 | |
| Downes, Cheryl* | 4 | 50% | 50% | 1.500 | 2.750 | 3.250 | -0.500 | ||
| Arnold, David* | 4 | 25% | 75% | 0.750 | 1.500 | 2.500 | -1.000 | ||
| Cowland, Dean* | 4 | 100% | 0.000 | 0.750 | 5.000 | -4.250 | |||
| Fragopoulos, Peter* | 4 | 25% | 25% | 50% | 1.000 | 1.250 | 2.000 | -0.750 | |
| Strobel, Joshua* | 4 | 50% | 50% | 1.500 | 2.000 | 1.500 | +0.500 | ||
| Irvine, Andrew* | 4 | 25% | 75% | 0.750 | 1.750 | 2.750 | -1.000 | ||
| Kelly, Bo* | 4 | 25% | 50% | 25% | 1.250 | 1.750 | 1.750 | +0.000 | |
| Strebs-Stelps, Ben* | 4 | 25% | 50% | 25% | 1.250 | 1.750 | 1.750 | +0.000 | |
| VellaVanKassel, Chris* | 4 | 25% | 50% | 25% | 1.250 | 1.750 | 1.750 | +0.000 | |
| Sparks, Steven | 3 | 33% | 67% | 0.333 | 0.000 | 7.000 | -7.000 | ||
| Downs, Colleen* | 3 | 33% | 67% | 0.333 | 1.667 | 5.667 | -4.000 | ||
| Shadbolt, Narelle* | 3 | 33% | 33% | 33% | 1.333 | 1.667 | 2.333 | -0.667 | |
| Crebbin, Kylie* | 3 | 67% | 33% | 0.667 | 0.667 | 1.667 | -1.000 | ||
| Dumbrell, Greg* | 3 | 33% | 33% | 33% | 1.333 | 2.333 | 2.667 | -0.333 | |
| Jungfer, Kathy* | 3 | 33% | 67% | 1.000 | 2.667 | 2.333 | +0.333 | ||
| Haycock, John* | 3 | 33% | 67% | 1.000 | 3.000 | 1.000 | +2.000 | ||
| Strebs-Stelps, Leo* | 3 | 33% | 67% | 0.333 | 1.333 | 2.000 | -0.667 | ||
| McMurrie, Michael* | 3 | 67% | 33% | 0.667 | 2.000 | 2.333 | -0.333 | ||
| Eppingstall, David | 2 | 100% | 0.000 | 0.000 | 4.500 | -4.500 | |||
| Fleming, Linda* | 2 | 50% | 50% | 1.500 | 3.000 | 4.000 | -1.000 | ||
| Mackay, Catherine* | 2 | 100% | 0.000 | 0.000 | 18.500 | -18.500 | |||
| Sproal, Beth* | 2 | 50% | 50% | 1.500 | 4.000 | 2.000 | +2.000 | ||
| Bell, Ray* | 2 | 50% | 50% | 0.500 | 1.500 | 2.000 | -0.500 | ||
| Corban, Malcolm* | 2 | 50% | 50% | 0.500 | 1.500 | 2.000 | -0.500 | ||
| Hooley, Aidan* | 2 | 50% | 50% | 0.500 | 1.500 | 2.000 | -0.500 | ||
| Hooley, Ryan* | 2 | 50% | 50% | 0.500 | 1.500 | 2.000 | -0.500 | ||
| Knipe, Lucas* | 2 | 50% | 50% | 0.500 | 1.500 | 2.000 | -0.500 | ||
| Murphy, Mathew* | 2 | 100% | 0.000 | 1.500 | 2.500 | -1.000 | |||
| Simpson, Matthew* | 2 | 100% | 0.000 | 1.500 | 2.500 | -1.000 | |||
| Atterbury, Greg | 1 | 100% | 3.000 | 6.000 | 5.000 | +1.000 | |||
| Remedios, Colin* | 1 | 100% | 0.000 | 1.000 | 5.000 | -4.000 | |||
| Mico, Neil | 1 | 100% | 1.000 | 1.000 | 1.000 | +0.000 | |||
| Cronje, Micheal* | 1 | 100% | 0.000 | 1.000 | 3.000 | -2.000 | |||
| Gilham, Mark* | 1 | 100% | 3.000 | 6.000 | 5.000 | +1.000 | |||
| Greed, Justin* | 1 | 100% | 0.000 | 2.000 | 4.000 | -2.000 | |||
| Gati, Nick* | 1 | 100% | 3.000 | 4.000 | 1.000 | +3.000 | |||
| Hosking, Robert* | 1 | 100% | 0.000 | 2.000 | 3.000 | -1.000 | |||
| Moroney, Jason | 1 | 100% | 0.000 | 2.000 | 3.000 | -1.000 | |||
| Gill, Jack | 1 | 100% | 1.000 | 1.000 | 1.000 | +0.000 | |||
| Knight, Jason* | 1 | 100% | 0.000 | 1.000 | 2.000 | -1.000 | |||
| Phillips, Chad* | 1 | 100% | 0.000 | 1.000 | 2.000 | -1.000 | |||
| Vallance, Lachlan* | 1 | 100% | 0.000 | 1.000 | 2.000 | -1.000 |
Opposition Teams
| Opponent |
Games |
Goals | Avge |
Win % | Draw % | Loss % | Unkn % | Avge. Points |
Avge. For | Avge. Aga | Avge. Diff. |
G.K. Games | Shut- outs | Shut- out % | Goals In | Goals Avge |
|---|---|---|---|---|---|---|---|---|---|---|---|---|---|---|---|---|
| St.Bedes | 15 | 27% | 7% | 67% | 0.867 | 1.400 | 2.933 | -1.533 | 15 | 44 | 2.933 | |||||
| Collegians-X | 14 | 57% | 21% | 21% | 1.929 | 2.429 | 1.714 | +0.714 | 14 | 3 | 21% | 24 | 1.714 | |||
| Footscray | 11 | 18% | 36% | 45% | 0.909 | 1.364 | 2.000 | -0.636 | 5 | 2 | 40% | 10 | 2.000 | |||
| RMIT | 11 | 4 | 0.364 | 18% | 82% | 0.545 | 1.818 | 4.000 | -2.182 | 9 | 1 | 11% | 37 | 4.111 | ||
| Casey | 10 | 40% | 20% | 40% | 1.400 | 2.100 | 3.800 | -1.700 | 10 | 38 | 3.800 | |||||
| Brunswick | 9 | 1 | 0.111 | 11% | 33% | 56% | 0.667 | 1.667 | 4.000 | -2.333 | 5 | 26 | 5.200 | |||
| Ajax-Maccabi | 9 | 33% | 67% | 1.000 | 2.000 | 2.778 | -0.778 | 9 | 25 | 2.778 | ||||||
| Sth. Knights | 8 | 13% | 63% | 25% | 1.000 | 2.125 | 3.000 | -0.875 | 8 | 1 | 13% | 24 | 3.000 | |||
| Swinburne | 7 | 57% | 43% | 2.143 | 3.286 | 1.000 | +2.286 | 7 | 3 | 43% | 7 | 1.000 | ||||
| Mornington | 7 | 43% | 29% | 29% | 1.571 | 1.286 | 1.286 | +0.000 | 7 | 2 | 29% | 9 | 1.286 | |||
| Baw-Baw | 7 | 29% | 14% | 57% | 1.000 | 1.143 | 2.286 | -1.143 | 7 | 1 | 14% | 16 | 2.286 | |||
| CBCOC | 6 | 100% | 0.000 | 1.167 | 3.500 | -2.333 | 6 | 21 | 3.500 | |||||||
| Trinity | 6 | 67% | 33% | 2.000 | 2.833 | 1.667 | +1.167 | 6 | 1 | 17% | 10 | 1.667 | ||||
| Old Yarra | 6 | 67% | 17% | 17% | 2.167 | 2.167 | 1.167 | +1.000 | 6 | 1 | 17% | 7 | 1.167 | |||
| Eastern | 6 | 33% | 67% | 0.333 | 1.333 | 2.833 | -1.500 | 6 | 17 | 2.833 | ||||||
| ECHO | 6 | 100% | 3.000 | 4.833 | 2.167 | +2.667 | 6 | 13 | 2.167 | |||||||
| Old Carey | 5 | 80% | 20% | 2.400 | 4.600 | 3.000 | +1.600 | 4 | 11 | 2.750 | ||||||
| Old Melburnians | 5 | 20% | 20% | 60% | 0.800 | 1.800 | 3.600 | -1.800 | 5 | 18 | 3.600 | |||||
| Sandringham | 4 | 25% | 75% | 0.750 | 2.250 | 4.000 | -1.750 | 4 | 16 | 4.000 | ||||||
| Frankston | 4 | 25% | 75% | 0.750 | 1.750 | 8.000 | -6.250 | 4 | 32 | 8.000 | ||||||
| Deakin | 4 | 50% | 50% | 1.500 | 2.250 | 3.750 | -1.500 | 4 | 15 | 3.750 | ||||||
| PEGS | 4 | 50% | 25% | 25% | 1.750 | 1.250 | 0.500 | +0.750 | 3 | 2 | 67% | 2 | 0.667 | |||
| Marcellin | 4 | 100% | 3.000 | 5.000 | 1.500 | +3.500 | 4 | 1 | 25% | 6 | 1.500 | |||||
| Old Haileybury | 4 | 75% | 25% | 2.250 | 3.750 | 1.250 | +2.500 | 4 | 5 | 1.250 | ||||||
| Old Xaverians | 4 | 100% | 0.000 | 1.250 | 4.000 | -2.750 | 4 | 16 | 4.000 | |||||||
| Chadstone | 4 | 25% | 75% | 0.250 | 2.750 | 4.500 | -1.750 | 4 | 18 | 4.500 | ||||||
| Latrobe Uni | 4 | 75% | 25% | 2.250 | 3.750 | 1.750 | +2.000 | 4 | 1 | 25% | 7 | 1.750 | ||||
| Essendon | 3 | 100% | 0.000 | 0.000 | 2.333 | -2.333 | 3 | 7 | 2.333 | |||||||
| Ballarat | 3 | 1 | 0.333 | 67% | 33% | 2.000 | 3.667 | 2.667 | +1.000 | 2 | 8 | 4.000 | ||||
| Werribee | 3 | 33% | 67% | 1.000 | 2.333 | 2.000 | +0.333 | 3 | 6 | 2.000 | ||||||
| Greensborough | 2 | 100% | 0.000 | 0.500 | 4.000 | -3.500 | 2 | 8 | 4.000 | |||||||
| Hawthorn | 2 | 100% | 0.000 | 0.000 | 14.000 | -14.000 | 2 | 28 | 14.000 | |||||||
| Yarra Valley | 2 | 100% | 1.000 | 1.000 | 1.000 | +0.000 | 2 | 2 | 1.000 | |||||||
| Camberwell | 2 | 100% | 0.000 | 1.000 | 3.000 | -2.000 | 2 | 6 | 3.000 | |||||||
| Altona | 2 | 100% | 0.000 | 0.000 | 6.500 | -6.500 | 2 | 13 | 6.500 | |||||||
| Corio | 2 | 100% | 0.000 | 1.500 | 4.500 | -3.000 | 2 | 9 | 4.500 | |||||||
| Grail | 2 | 50% | 50% | 0.500 | 2.500 | 4.500 | -2.000 | 2 | 9 | 4.500 | ||||||
| Reservoir | 2 | 50% | 50% | 1.500 | 1.000 | 1.000 | +0.000 | 2 | 1 | 50% | 2 | 1.000 | ||||
| SNP | 2 | 100% | 0.000 | 1.000 | 4.000 | -3.000 | 2 | 8 | 4.000 | |||||||
| Elwood | 2 | 50% | 50% | 1.500 | 0.500 | 0.500 | +0.000 | 2 | 1 | 50% | 1 | 0.500 | ||||
| Vic Sihks | 2 | 50% | 50% | 2.000 | 5.000 | 3.500 | +1.500 | 2 | 7 | 3.500 | ||||||
| Bendigo | 2 | 50% | 50% | 0.500 | 1.500 | 2.500 | -1.000 | 2 | 5 | 2.500 | ||||||
| Kew | 1 | 100% | 0.000 | 0.000 | 21.000 | -21.000 | 1 | 21 | 21.000 | |||||||
| MUHC | 1 | 100% | 1.000 | 1.000 | 1.000 | +0.000 | 1 | 1 | 1.000 | |||||||
| Melton | 1 | 100% | 3.000 | 2.000 | 1.000 | +1.000 | 1 | 1 | 1.000 | |||||||
| Bayside | 1 | 100% | 1.000 | 2.000 | 2.000 | +0.000 | 1 | 2 | 2.000 | |||||||
| Opponents :46 | 221 | 6 | 0.027 | 34% | 17% | 49% | 1.199 | 2.068 | 2.946 | -0.878 | 206 | 21 | 10% | 618 | 3.000 |
Playing Venues
| Venue | Games |
Goals | Avge. |
Win % | Draw % | Loss % | Unkn % | Avge. Points |
Avge. For | Avge. Aga | Avge. Diff. |
G.K. Games | Shut- outs | Shut- out % | Goals In | Goals Avge. |
|---|---|---|---|---|---|---|---|---|---|---|---|---|---|---|---|---|
| Melton Mowbray | 75 | 47% | 16% | 37% | 1.560 | 2.440 | 2.480 | -0.040 | 75 | 13 | 17% | 186 | 2.480 | |||
| Footscray | 38 | 6 | 0.158 | 29% | 21% | 50% | 1.079 | 1.816 | 2.368 | -0.553 | 23 | 6 | 26% | 57 | 2.478 | |
| SHC | 15 | 33% | 13% | 53% | 1.133 | 2.067 | 2.733 | -0.667 | 15 | 41 | 2.733 | |||||
| Werribee | 9 | 11% | 22% | 67% | 0.556 | 1.333 | 2.778 | -1.444 | 9 | 25 | 2.778 | |||||
| Waverley | 9 | 11% | 22% | 67% | 0.556 | 2.222 | 4.000 | -1.778 | 9 | 36 | 4.000 | |||||
| Mentone | 7 | 43% | 57% | 1.286 | 1.571 | 3.571 | -2.000 | 7 | 25 | 3.571 | ||||||
| Hawthorn | 6 | 33% | 17% | 50% | 1.167 | 2.333 | 3.833 | -1.500 | 6 | 1 | 17% | 23 | 3.833 | |||
| Dandenong | 6 | 17% | 50% | 33% | 1.000 | 2.167 | 2.833 | -0.667 | 6 | 17 | 2.833 | |||||
| Berwick | 6 | 17% | 50% | 33% | 1.000 | 1.833 | 4.833 | -3.000 | 6 | 29 | 4.833 | |||||
| Reservoir | 5 | 20% | 80% | 0.600 | 1.400 | 5.200 | -3.800 | 5 | 26 | 5.200 | ||||||
| Doncaster | 5 | 40% | 20% | 40% | 1.400 | 2.200 | 1.600 | +0.600 | 5 | 8 | 1.600 | |||||
| Monash | 4 | 25% | 75% | 0.250 | 0.750 | 2.000 | -1.250 | 4 | 8 | 2.000 | ||||||
| Altona | 3 | 100% | 0.000 | 0.000 | 15.333 | -15.333 | 3 | 46 | 15.333 | |||||||
| Geelong | 3 | 33% | 67% | 1.000 | 2.667 | 3.667 | -1.000 | 3 | 11 | 3.667 | ||||||
| Albert Park | 3 | 33% | 67% | 1.000 | 2.000 | 3.000 | -1.000 | 3 | 9 | 3.000 | ||||||
| Trinity | 3 | 33% | 67% | 1.000 | 2.333 | 2.667 | -0.333 | 3 | 8 | 2.667 | ||||||
| Elgar Park | 3 | 100% | 3.000 | 2.667 | 1.667 | +1.000 | 3 | 1 | 33% | 5 | 1.667 | |||||
| Knox | 3 | 33% | 67% | 0.333 | 1.667 | 3.333 | -1.667 | 3 | 10 | 3.333 | ||||||
| Moorabbin | 3 | 100% | 3.000 | 4.333 | 2.000 | +2.333 | 3 | 6 | 2.000 | |||||||
| Essendon | 2 | 100% | 0.000 | 0.500 | 3.000 | -2.500 | 2 | 6 | 3.000 | |||||||
| Haileybury | 2 | 50% | 50% | 1.500 | 3.000 | 1.000 | +2.000 | 2 | 2 | 1.000 | ||||||
| Frankston | 2 | 50% | 50% | 1.500 | 1.000 | 1.500 | -0.500 | 2 | 3 | 1.500 | ||||||
| Melb Grammar | 2 | 50% | 50% | 1.500 | 3.000 | 2.500 | +0.500 | 2 | 5 | 2.500 | ||||||
| Greensborough | 1 | 100% | 0.000 | 0.000 | 4.000 | -4.000 | 1 | 4 | 4.000 | |||||||
| Yarra Velodrome | 1 | 100% | 1.000 | 1.000 | 1.000 | +0.000 | 1 | 1 | 1.000 | |||||||
| Camberwell | 1 | 100% | 0.000 | 1.000 | 3.000 | -2.000 | 1 | 3 | 3.000 | |||||||
| Mordialloc | 1 | 100% | 0.000 | 1.000 | 8.000 | -7.000 | 1 | 8 | 8.000 | |||||||
| Brighton | 1 | 100% | 0.000 | 1.000 | 3.000 | -2.000 | 1 | 3 | 3.000 | |||||||
| Ballarat | 1 | 100% | 3.000 | 4.000 | 3.000 | +1.000 | 1 | 3 | 3.000 | |||||||
| Bendigo | 1 | 100% | 0.000 | 2.000 | 4.000 | -2.000 | 1 | 4 | 4.000 | |||||||
| Venues :30 | 221 | 6 | 0.027 | 34% | 17% | 49% | 1.199 | 2.068 | 2.946 | -0.878 | 206 | 21 | 10% | 618 | 3.000 |